Copyright
©2005 Baishideng Publishing Group Inc.
World J Gastroenterol. Nov 28, 2005; 11(44): 6899-6904
Published online Nov 28, 2005. doi: 10.3748/wjg.v11.i44.6899
Published online Nov 28, 2005. doi: 10.3748/wjg.v11.i44.6899
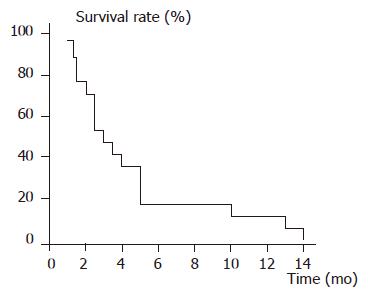
Figure 1 Kaplan-Meier survival curve of all cases (n = 17).
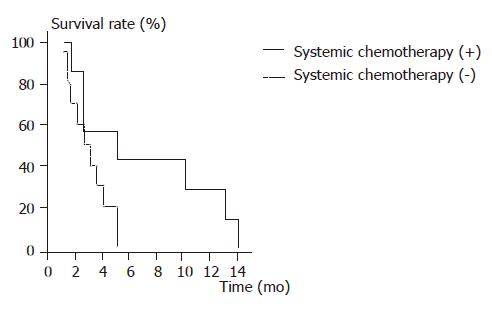
Figure 2 Kaplan-Meier survival curve according to administration of systemic chemotherapy.
The cases treated with systemic chemotherapy were more likely to survive longer (P = 0.0579) than those who were not treated with systemic chemotherapy.
Figure 3 Kaplan-Meier survival curve according to time period between the diagnosis of gastric cancer and diagnosis of cardiac tamponade.
The cases in whom cardiac tamponades were diagnosed for more than 24 mo after the diagnosis with gastric cancer were more likely to survive longer than those in whom cardiac tamponade was diagnosed for less than 24 mo after the initial diagnosis of gastric cancer. However, there was no statistical difference between the two groups (P = 0.1130).
Figure 4 Kaplan-Meier survival curve according to CEA levels.
The cases with normal CEA levels had a longer survival period as compared to those with high CEA levels (P = 0.0071).
- Citation: Kobayashi M, Okabayashi T, Okamoto K, Namikawa T, Araki K. Clinicopathological study of cardiac tamponade due to pericardial metastasis originating from gastric cancer. World J Gastroenterol 2005; 11(44): 6899-6904
- URL: https://www.wjgnet.com/1007-9327/full/v11/i44/6899.htm
- DOI: https://dx.doi.org/10.3748/wjg.v11.i44.6899


