Copyright
©2005 Baishideng Publishing Group Inc.
World J Gastroenterol. Nov 7, 2005; 11(41): 6518-6520
Published online Nov 7, 2005. doi: 10.3748/wjg.v11.i41.6518
Published online Nov 7, 2005. doi: 10.3748/wjg.v11.i41.6518
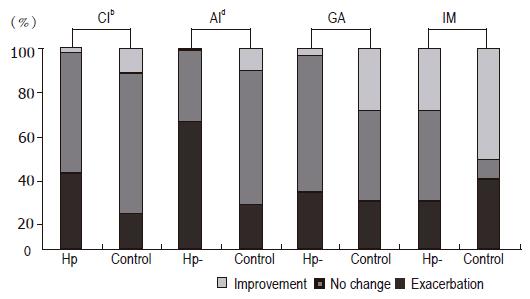
Figure 1 Percentage changes in gastric histology 3 years after treatment in H pylori-eradicated group and control group.
bP < 0.01, dP < 0.001 vs baseline. CI: chronic inflammation; AI: active inflammation; GA: glandular atrophy; IM: intestinal metaplasia; Hp-: H pylori-eradicated group; Control: the control group.
-
Citation: Lu B, Chen MT, Fan YH, Liu Y, Meng LN. Effects of
Helicobacter pylori eradication on atrophic gastritis and intestinal metaplasia: A 3-year follow-up study. World J Gastroenterol 2005; 11(41): 6518-6520 - URL: https://www.wjgnet.com/1007-9327/full/v11/i41/6518.htm
- DOI: https://dx.doi.org/10.3748/wjg.v11.i41.6518


