Copyright
©The Author(s) 2005.
World J Gastroenterol. Aug 28, 2005; 11(32): 4979-4985
Published online Aug 28, 2005. doi: 10.3748/wjg.v11.i32.4979
Published online Aug 28, 2005. doi: 10.3748/wjg.v11.i32.4979
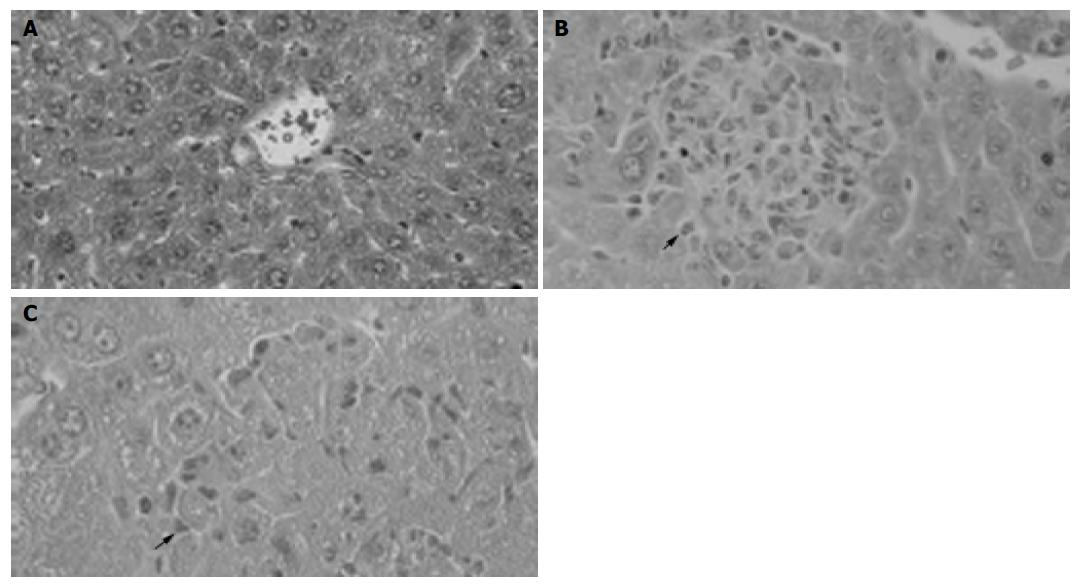
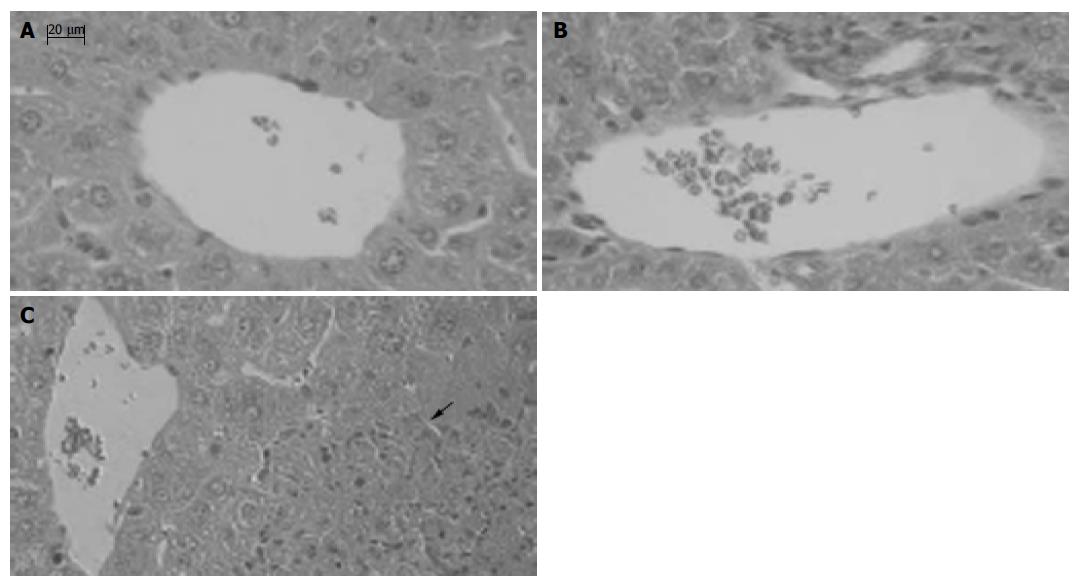
Figure 1 Pathological examination showing granuloma formation with BCG administration and hepatocellular necrosis followed by LPS injection.
H&E staining of cross-sections of normal liver (A), 12 d after BCG injection (B) and BCG-primed mice sequentially challenged with LPS (C). Bars = 20 mm.
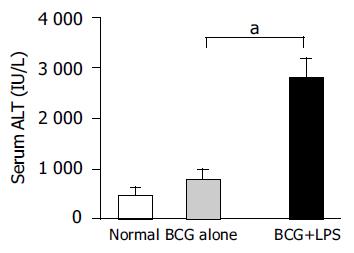
Figure 2 Levels of serum ALT in mice.
The serum ALT levels of mice (n = 5 at each group) were measured as described in Materials and methods. Data represent mean±SD. aP<0.05 vs BCG-primed mice.
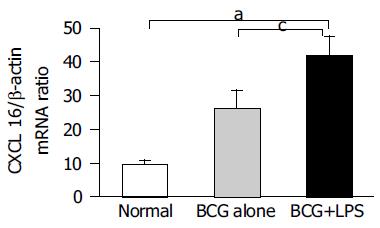
Figure 3 Detection of CXCL16 mRNA in the injured liver by real-time quantitative RT-PCR analysis.
Total RNA was isolated from the liver tissues at the different group as indicated and then reverse transcribed with reverse transcriptase and amplified by real-time quantitative PCR specific for CXCL16. Amplification of b-actin by same approach was used as control. The results represent three independent experiments. aP<0.05 vs normal mice, cP<0.05 vs BCG-primed mice.
Figure 4 Immunohistochemical examination of CXCL16 expression in liver tissue.
Sections of livers were obtained from normal mice without any treatment (A) and BCG-primed mice sequentially injected with LPS (B). CXCL16-positive (brown) cells are shown in the liver tissue with hematoxylin counterstaining. Bars = 20 mm.
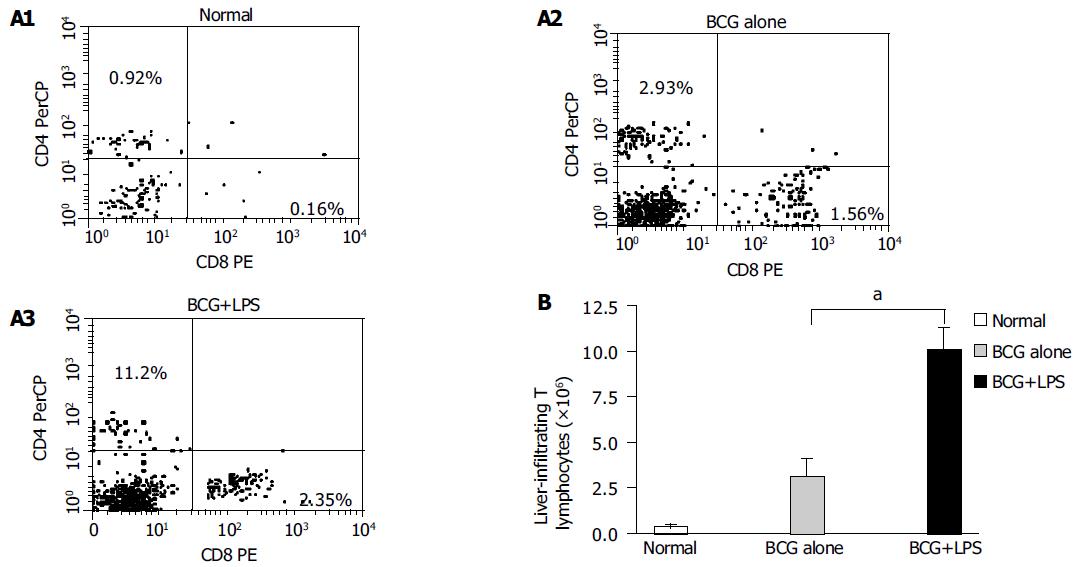
Figure 5 Analysis of liver-infiltrating CD4+ and CD8+T lymphocytes population in liver injury induced by BCG and LPS.
Mice were primed with BCG and sequentially challenged by LPS, 12 d after priming. MNCs derived from normal (without any treatment, open bars); BCG-primed (horizontal bars) and BCG-primed plus LPS challenged mice (hatched bars) were harvested for FACS analysis. A1-A3: The CD4+ and CD8+T lymphocytes population were analyzed with FACS; B: the absolute number of T lymphocytes was determined by multiplying the total MNC number by the fraction of CD4+, CD8+T-lymphocytes population. aP<0.05 vs BCG-primed mice.
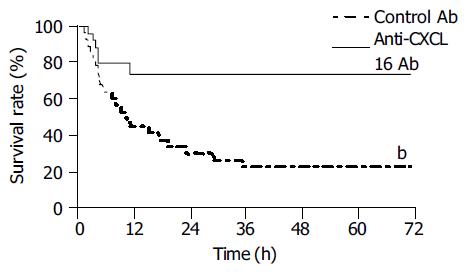
Figure 6 Protective effect of anti-CXCL16 antibody on survival rate for murine lethal hepatic failure.
Immunological liver injury was induced by BCG and LPS treatment and anti-CXCL16 Ab (solid line, n = 10) or control Ab (dashed line, n = 10) was injected as indicated in Materials and methods. The anti-CXCL16 antibody significantly protected the mice from lethality (bP<0.01 vs control Ab).
Figure 7 Effects of anti-CXCL16 antibody on intrahepatic infiltration of T lymphocytes and serum ALT level in the mice.
Mice were primed with BCG and sequentially challenged by LPS 12 d after priming. Anti-CXCL16 antibody and isotype antibody were administrated into the mice, respectively. A: T lymphocytes derived from the mice treated with either anti-CXCL16 antibody (closed bars) or isotype antibody (hatched bars) was harvested for FACS analysis. The absolute number of T lymphocytes was determined by multiplying the total MNC number by the fraction of CD3+T lymphocytes population. aP<0.05 vs control Ab treatment. B: Anti-CXCL16 antibody significantly suppressed the elevation of serum ALT. bP<0.01 vs control Ab group. Results were obtained from three independent experiments.
Figure 8 Effect of anti-CXCL16 antibody on the formation of hepatic lesion in liver injury induced by BCG and LPS.
Sections of livers were obtained as follows: A: The liver tissue without any treatment; B: The liver tissue of mice primed with BCG was treated with the anti-CXCL16 Ab followed by LPS challenge; C: The liver tissue of mice primed with BCG was treated with nonimmune rat IgG followed by LPS challenge. An arrow shows a necrotic lesion. Tissues were stained with H&E and examined histologically. Bars = 20 mm.
- Citation: Xu HB, Gong YP, Cheng J, Chu YW, Xiong SD. CXCL16 participates in pathogenesis of immunological liver injury by regulating T lymphocyte infiltration in liver tissue. World J Gastroenterol 2005; 11(32): 4979-4985
- URL: https://www.wjgnet.com/1007-9327/full/v11/i32/4979.htm
- DOI: https://dx.doi.org/10.3748/wjg.v11.i32.4979


