Copyright
©2005 Baishideng Publishing Group Co.
World J Gastroenterol. Jan 21, 2005; 11(3): 344-347
Published online Jan 21, 2005. doi: 10.3748/wjg.v11.i3.344
Published online Jan 21, 2005. doi: 10.3748/wjg.v11.i3.344
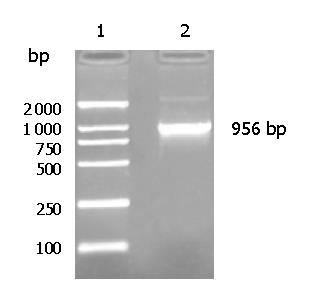
Figure 1 Representative RT-PCR results of Ep-CAM from colon malignant tissue.
Lane 1: marker of DL2000; lane 2: Ep-CAM cDNA.
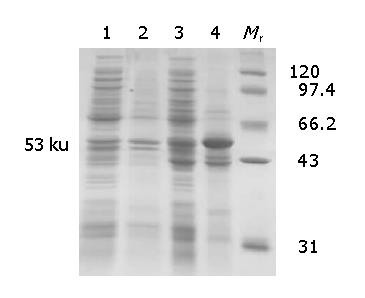
Figure 2 SDS-PAGE of Ep-CAM-GST fusion protein.
Lane Mr: low molecule weight protein marker; lane 1: bacteria culture without IPTG induction; lane 2: bacteria culture with IPTG induction for 0 h; lane 3: bacteria culture with IPTG induction for 2 h; lane 4: bacteria culture with IPTG induction for 7 h.
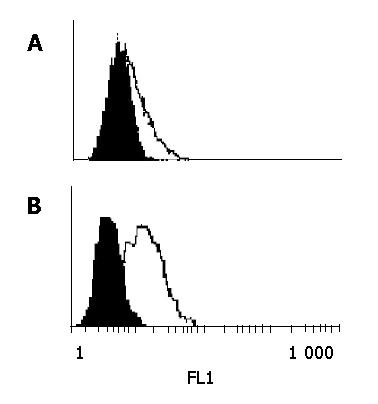
Figure 3 Flow cytometric analysis of Ep-CAM distribution with MAb FMU-Ep4.
A: Colo205 cell line; B: SW480 cell line.
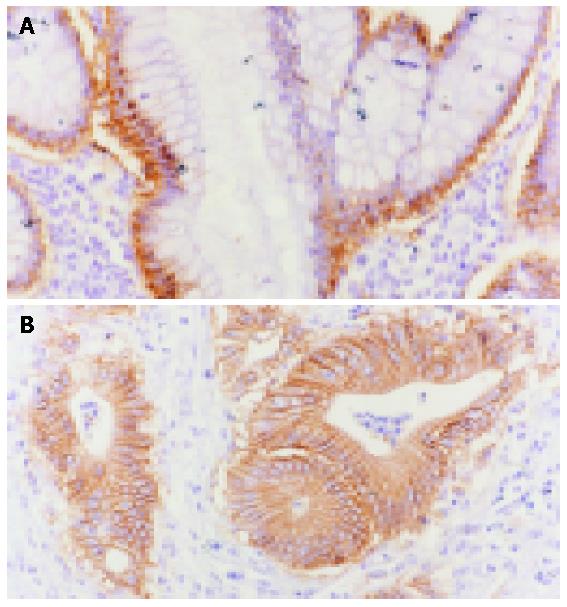
Figure 4 Ep-CAM staining with anti-Ep-CAM mAb FMU-Ep1 on colon tissues (×400).
A: normal colon tissue; B: malignant colon tissue.
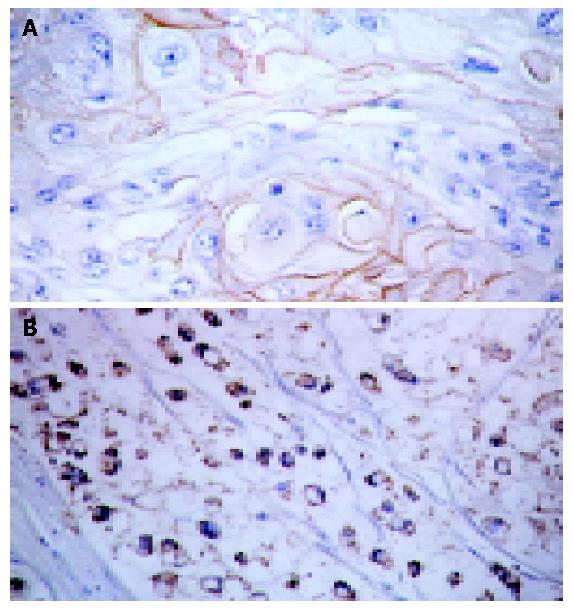
Figure 5 Representative Ep-CAM staining with anti-Ep-CAM MAb FMU-Ep1 on human colon carcinoma tissue array (×400).
A: signet-ring carcinoma; B: squamous cell carcinoma.
- Citation: Xie X, Wang CY, Cao YX, Wang W, Zhuang R, Chen LH, Dang NN, Fang L, Jin BQ. Expression pattern of epithelial cell adhesion molecule on normal and malignant colon tissues. World J Gastroenterol 2005; 11(3): 344-347
- URL: https://www.wjgnet.com/1007-9327/full/v11/i3/344.htm
- DOI: https://dx.doi.org/10.3748/wjg.v11.i3.344


