Copyright
©The Author(s) 2005.
World J Gastroenterol. Jul 14, 2005; 11(26): 4052-4060
Published online Jul 14, 2005. doi: 10.3748/wjg.v11.i26.4052
Published online Jul 14, 2005. doi: 10.3748/wjg.v11.i26.4052
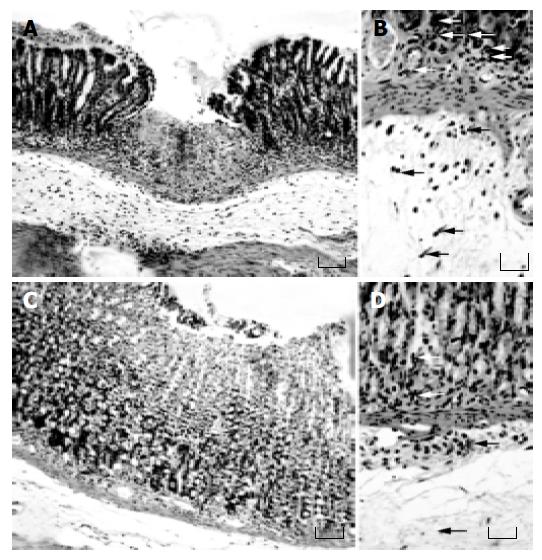
Figure 1 H&E-stained sections of rat gastric mucosa.
A, treatment with indomethacin 100 µmol/kg, A: severe lesion with necrosis of gastric mucosa; B: several polymorphonuclear cell scan be detected (arrows); C and D: Rats treated with lansoprazole 90 mmol/kg plus indomethacin 100 µmol/kg, C: less severe lesion with lysis of mucosal cells; D: few polymorphonuclear cells can be evidenced (arrows). A and C: original magnification 100; bar = 150 µm. B and D: original magnification 170 x; bar = 60 µm.
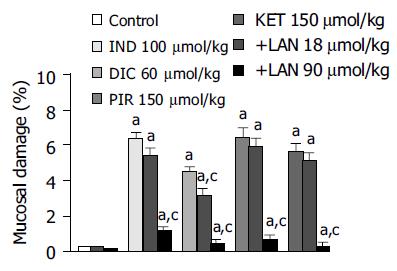
Figure 2 Histomorphometric evaluation of gastric mucosal damage in rats subjected to intragastric administration of indomethacin (IND, 100 µmol/kg), diclofenac (DIC, 60 µmol/kg), piroxicam (PIR, 150µmol/kg) or ketoprofen (KET, 150 µmol/kg) either alone or in the presence of lansoprazole (LAN, 18 and 90 µmol/kg).
Each column indicates the mean value obtained from 6-8 animals ± SE (vertical lines). aP < 0.05 vs control values; cP < 0.05 between the respective values obtained in animals treated with a test NSAID alone.
Figure 3 MPO (A), MDA (B) and GSH (C) levels in the gastric mucosa of rats treated with indomethacin (IND, 100 µmol/kg) or piroxicam (PIR, 150 µmol/kg), either alone or in the presence of lansoprazole (LAN, 90 µmol/kg).
Each column represents the mean value obtained from 7 to 10 animals ± SE. aP < 0.05 vs control values; cP < 0.05 between the respective values obtained in animals treated with indomethacin or piroxicam alone.
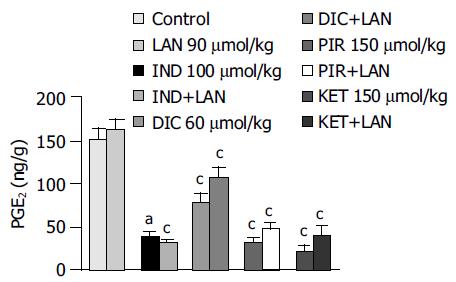
Figure 4 PGE2 levels in the gastric mucosa of rats treated with indomethacin (IND, 100 µmol/kg), diclofenac (DIC, 60 µmol/kg), piroxicam (PIR, 150 µmol/kg) or ketoprofen (KET, 150 µmol/kg), either alone or in the presence of lansoprazole (LAN, 90 µmol/kg).
Each column represents the mean value obtained from 6 to 8 animals ± SE (vertical lines). aP < 0.05 vs control values; cP < 0.05 between the respective values obtained in animals treated with a test NSAID alone.
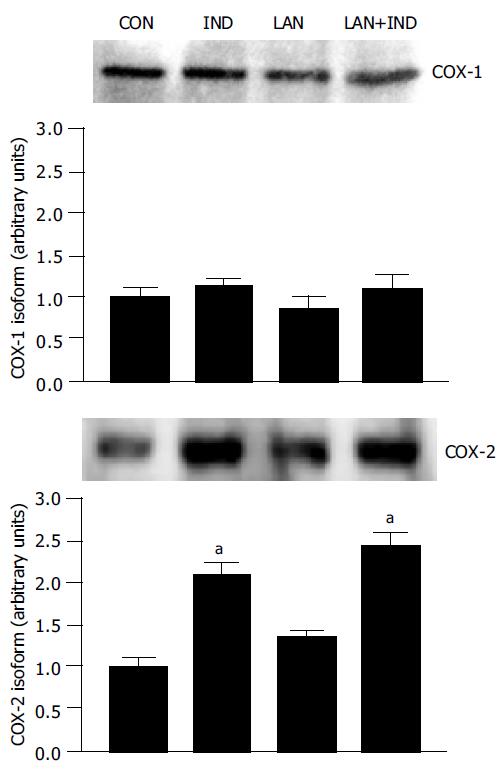
Figure 5 Western blot analysis of COX-1 and COX-2protein expression in gastric mucosal lysates obtained from animals treated with indomethacin (IND), lansoprazole (LAN, 90 µmol/kg) or lansoprazole plus indomethacin (LAN+IND).
aP < 0.05 vs the control values (CON).
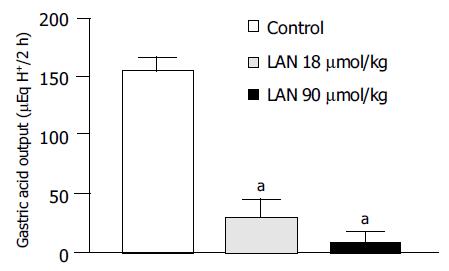
Figure 6 Rats subjected to pylorus ligation.
Effect of lansoprazole (LAN, 18 and 90 µmol/kg) on gastric acid secretion. Each column represents the mean value obtained from six experiments ±SE(vertical lines). aP < 0.05 vs the control values.
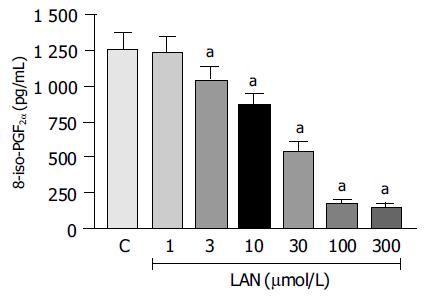
Figure 7 8-Iso-PGF2α levels generated in vitro upon oxidation of native LDLs by CuSO4, either in the absence (C, control) or in the presence of increasing concentrations of lansoprazole (LAN).
Each column represents the mean value obtained from 5-6 experiments±SE (vertical lines). aP < 0.05 vs the control values.
- Citation: Blandizzi C, Fornai M, Colucci R, Natale G, Lubrano V, Vassalle C, Antonioli L, Lazzeri G, Tacca MD. Lansoprazole prevents experimental gastric injury induced by non-steroidal anti-inflammatory drugs through a reduction of mucosal oxidative damage. World J Gastroenterol 2005; 11(26): 4052-4060
- URL: https://www.wjgnet.com/1007-9327/full/v11/i26/4052.htm
- DOI: https://dx.doi.org/10.3748/wjg.v11.i26.4052


