Copyright
©The Author(s) 2005.
World J Gastroenterol. Jul 14, 2005; 11(26): 4008-4012
Published online Jul 14, 2005. doi: 10.3748/wjg.v11.i26.4008
Published online Jul 14, 2005. doi: 10.3748/wjg.v11.i26.4008
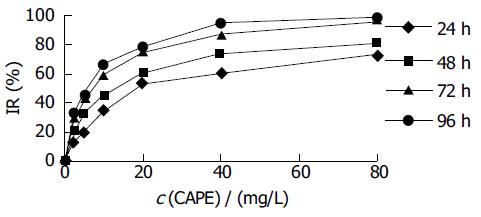
Figure 1 Effect of CAPE on HCT116 cell proliferation.
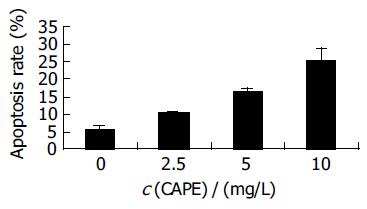
Figure 2 Effect of CAPE on HCT116 cell apoptosis rates.
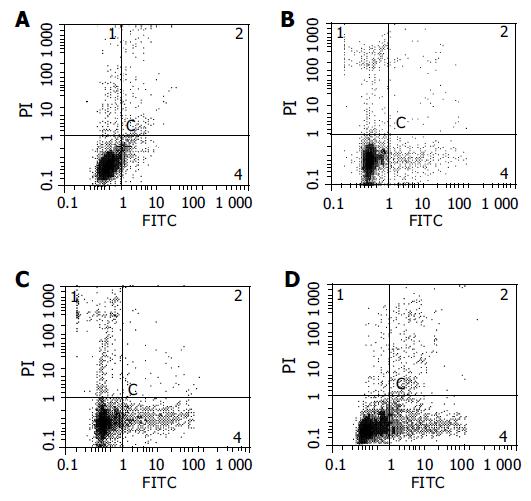
Figure 3 Annexin-V and PI double-staining FCM of HCT116 cells following 24 h incubation with (A) control, (B) 2.
5 mg/L CAPE, (C) 5.0 mg/L CAPE, (D)10 mg/L CAPE.
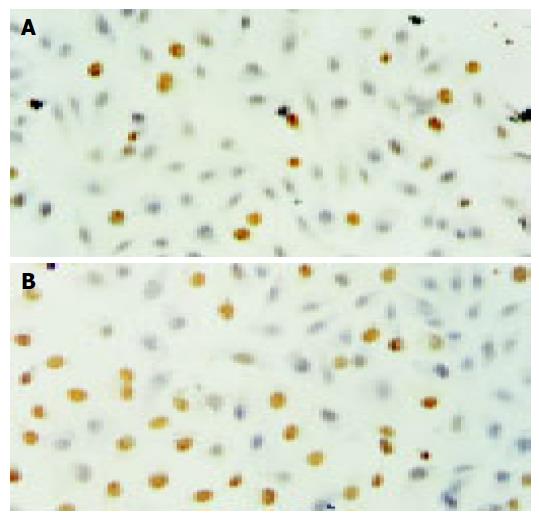
Figure 4 TUNEL assay of HCT116 cells following 24 h incubation with (A) 2.
5 mg/L CAPE, (B) 10 mg/L CAPE.
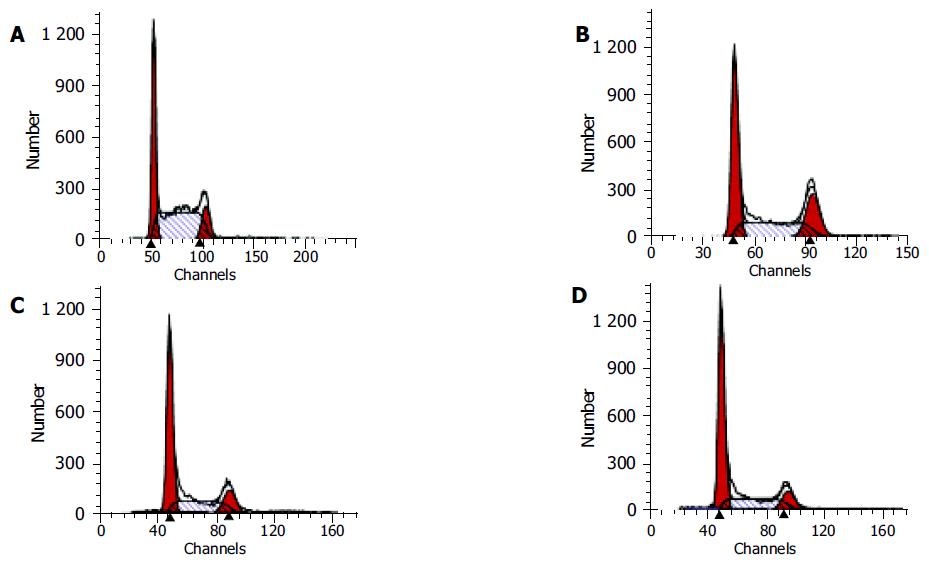
Figure 5 Flow cytometry of HCT116 cells following 24 h incubation with (A) control, (B) 2.
5 mg/L CAPE, (C) 5.0 mg/L CAPE, (D) 10 mg/L CAPE.
Figure 6 Western blot analysis of β-catenin protein expression in HCT116 cells following 24 h (Lanes 1-4) and 48 h (Lanes 5-8) incubation with different concentrations of CAPE.
Lanes 1-4: control, 2.5 mg/L CAPE, 5.0 mg/L CAPE, 10 mg/L CAPE; Lanes 5-8: control, 2.5 mg/L CAPE, 5.0 mg/L CAPE, 10 mg/L CAPE.
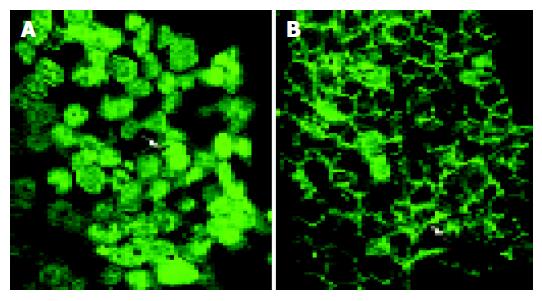
Figure 7 Indirect immunofluorescence analysis of β-catenin protein expression in HCT116 cells following 48 h incubation with (A) control, (B) 10 mg/L CAPE.
- Citation: Wang D, Xiang DB, He YJ, Li ZP, Wu XH, Mou JH, Xiao HL, Zhang QH. Effect of caffeic acid phenethyl ester on proliferation and apoptosis of colorectal cancer cells in vitro. World J Gastroenterol 2005; 11(26): 4008-4012
- URL: https://www.wjgnet.com/1007-9327/full/v11/i26/4008.htm
- DOI: https://dx.doi.org/10.3748/wjg.v11.i26.4008


