Copyright
©The Author(s) 2005.
World J Gastroenterol. Jul 14, 2005; 11(26): 3990-3997
Published online Jul 14, 2005. doi: 10.3748/wjg.v11.i26.3990
Published online Jul 14, 2005. doi: 10.3748/wjg.v11.i26.3990
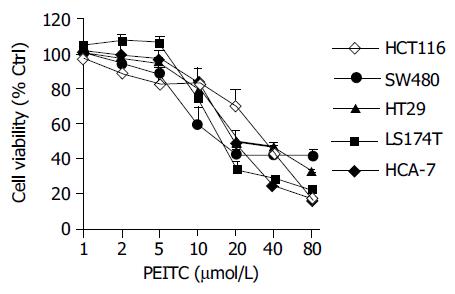
Figure 1 (A) Concentration dependant loss of cell viability induced by PEITC in colon cancer cells as determined at 24 h using the MTT viability assay.
Data are representative of three or more separate experiments (mean±SD).
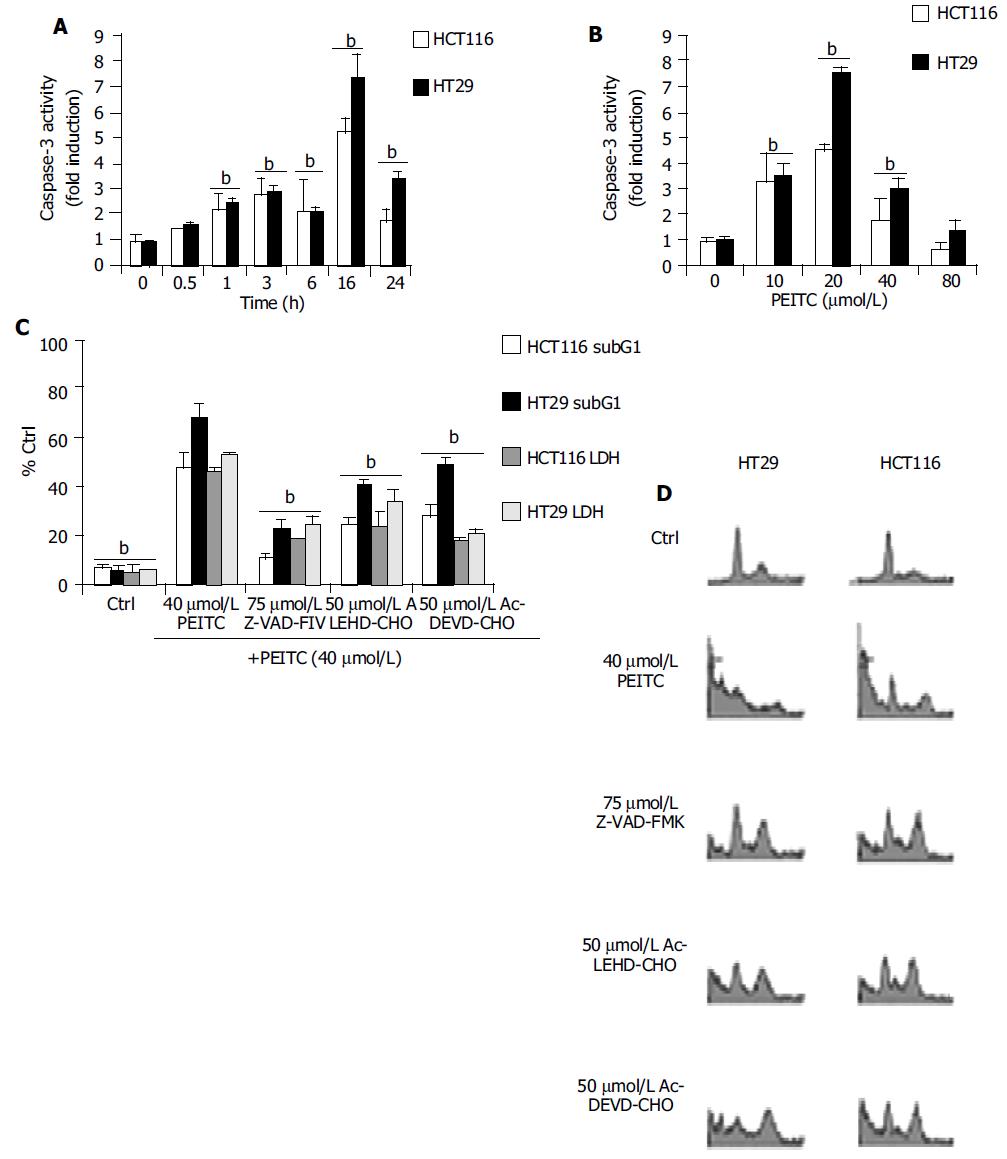
Figure 2 A: Time dependant Induction of caspase -3 activities in HCT116 and HT29 cells treated with 40 µmol/L PEITC as determined at 0.
5, 1, 3, 6, 16 and 24 h. B: Concentration dependant activation of caspase-3 as determined at 24 h after incubation with PEITC (10-80 µmol/L). C: Z-VAD-FMK, Ac-LEHD-CHO and Ac-DEVD-CHO inhibition on PEITC mediated apoptosis as determined at 24 h. bP < 0.01, significant difference compared to control groups. Cells were treated with individual caspase inhibitors for 1 h prior to the addition of 40 µmol/L PEITC. SubG1 populations were determined by propodium iodide staining followed by flow cytometry analysis as described in the materials and methods. bP < 0.01, comparing PEITC (alone) with control groups. D: Representative flow cytometry analysis of HCT116 and HT29 cells was used to determine the extent of DNA fragmentation in cells treated with PEITC (40 µmol/L) in the presence of caspase inhibitors. Data were determined by PI staining at 24 h. Figure shows representative example of at least 3 experiments. In each analysis, 10 000 events were recorded. bP < 0.01, PEITC (alone) vs control and caspase inhibitor treated groups.
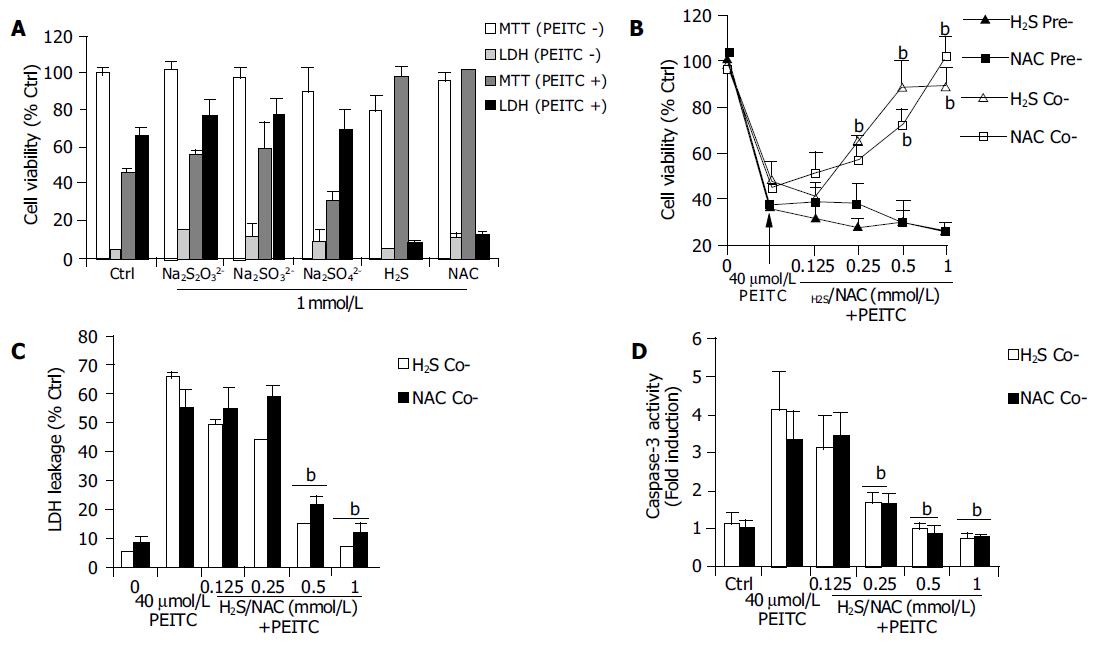
Figure 3 A: Effects of low molecular weight sulfur compounds on PEITC mediate loss of cell viability; B and C: Inhibition of PEITC mediated loss of cell viability in HCT116 cells following either co-treatment or pre-treatment (24 h) with H2S or NAC (125 µmol-1 mmol/L) as determined by MTT or LDH leakage.
Data are expressed as mean±SD, (n = 8); D: Co-treatment with either H2S or NAC (125 µmol-1 mmol/L) inhibits PEITC induced caspase-3 activity as determined at 16 h and Data are representative of 3 or more separate experiments conducted on separate occasions. mean±SD, bP < 0.01 vs PEITC treated groups.
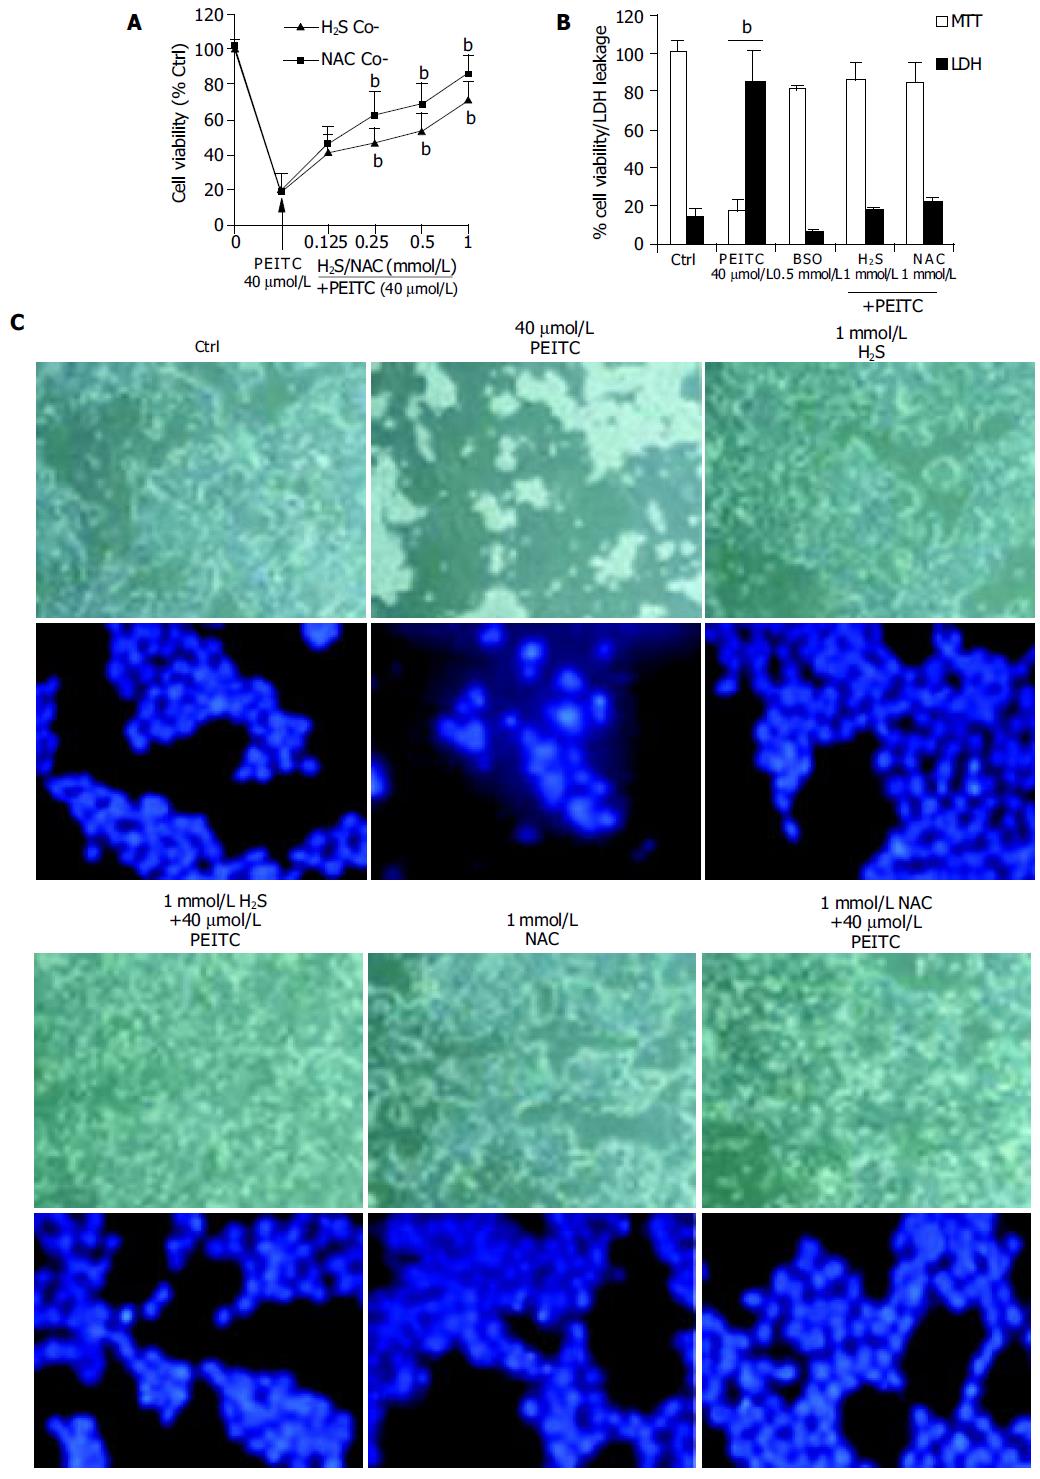
Figure 4 Inhibition of PEITC mediated loss in cell viability in GSH depleted cells following pre-treatment with 0.
5 mmol/L BSO for 24 h. Both H2S and NAC inhibited PEITC induced loss of cell viability in concentration dependant manner as determined using the MTT assay (A) and (B) LDH leakage. (C) Respective
- Citation: Rose P, Moore PK, Ming SH, Nam OC, Armstrong JS, Whiteman M. Hydrogen sulfide protects colon cancer cells from chemopreventative agent β-phenylethyl isothiocyanate induced apoptosis. World J Gastroenterol 2005; 11(26): 3990-3997
- URL: https://www.wjgnet.com/1007-9327/full/v11/i26/3990.htm
- DOI: https://dx.doi.org/10.3748/wjg.v11.i26.3990


