Copyright
©The Author(s) 2005.
World J Gastroenterol. Jul 7, 2005; 11(25): 3893-3898
Published online Jul 7, 2005. doi: 10.3748/wjg.v11.i25.3893
Published online Jul 7, 2005. doi: 10.3748/wjg.v11.i25.3893
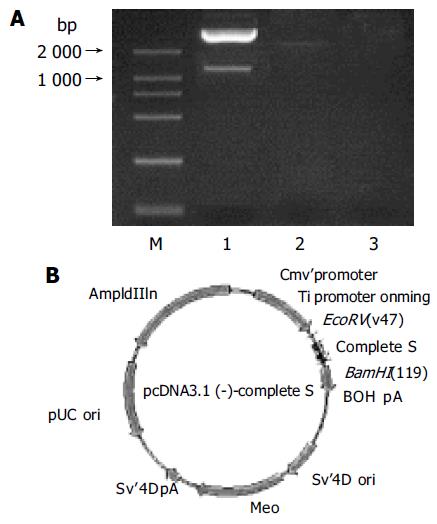
Figure 1 Electrophoresis of PCR products of pcDNA3-complete S and cleaved restriction enzyme (A).
Structure of expression vector pcDNA3.1(-)-complete S plasmid(B).
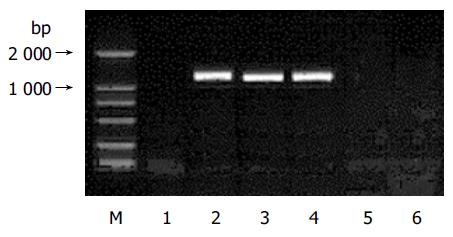
Figure 2 Electrophoresis of RT-PCR products in 0.
9% agarose gel. Lane 1: negative control; lanes 2-4: mRNA isolated from pcDNA3.1(-)-complete S; lane 5: blank control; M: DNA marker (2 000 bp).
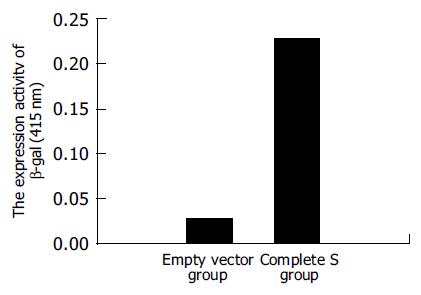
Figure 3 Result of β-galactosidase enzyme analysis.
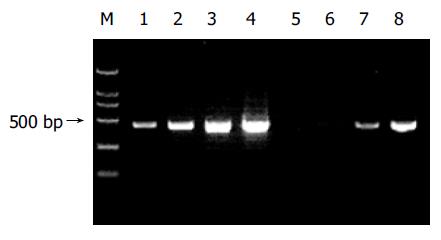
Figure 4 Reduction of G3PDH abundance by PCR-selection subtraction.
Lanes 1 and 5: 18 cycles; lanes 2 and 6: 23 cycles; lanes 3 and 7: 28 cycles; lanes 4 and 8: 33 cycles. Lane M: marker (2 000 bp).
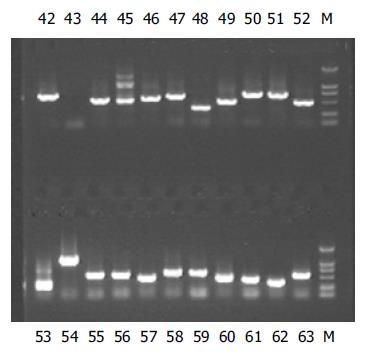
Figure 5 Electrophoresis of PCR products of part clones (42-63) on 0.
9% agarose gel; M: marker (2 000 bp).
Figure 6 Smears of HBV complete S after PCR.
- Citation: Bai GQ, Liu Y, Cheng J, Zhang SL, Yue YF, Huang YP, Zhang LY. Transactivating effect of complete S protein of hepatitis B virus and cloning of genes transactivated by complete S protein using suppression subtractive hybridization technique. World J Gastroenterol 2005; 11(25): 3893-3898
- URL: https://www.wjgnet.com/1007-9327/full/v11/i25/3893.htm
- DOI: https://dx.doi.org/10.3748/wjg.v11.i25.3893


