Copyright
©2005 Baishideng Publishing Group Inc.
World J Gastroenterol. May 28, 2005; 11(20): 3105-3111
Published online May 28, 2005. doi: 10.3748/wjg.v11.i20.3105
Published online May 28, 2005. doi: 10.3748/wjg.v11.i20.3105
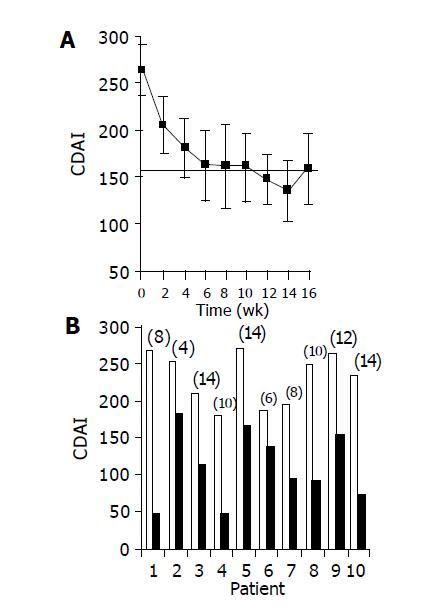
Figure 1 Effect of the study drug on CDAI score.
A: mean±SE CDAI scores over time during the treatment period; B: CDAI scores of individual patients: Baseline score (wk 0, open bars) as compared with score at time of maximal decrease (black bars, no. of week appears for each patient in parenthesis above bar).
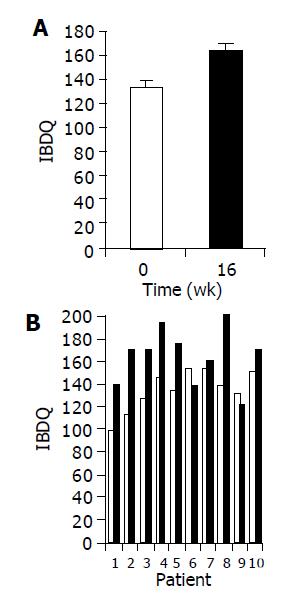
Figure 2 Effect of the study drug on IBDQ scores.
A: Mean IBDQ scores (±SE) at baseline (wk 0, open bars) as compared to end of treatment (wk 16, black bars); B: IBDQ score of individual patients at baseline as compared to wk 16.
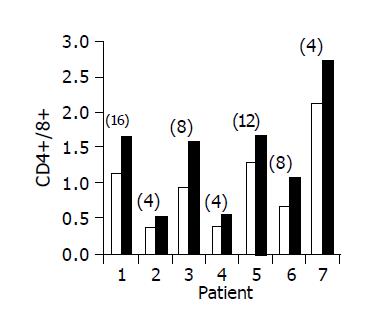
Figure 3 Peripheral CD4+/CD8+ lymphocyte ratio in 7/10 patients in whom a significant increase was observed.
Baseline ratio (open bars) as compared to level of maximal increase (black bars, no. of week shown in parenthesis above each bar).
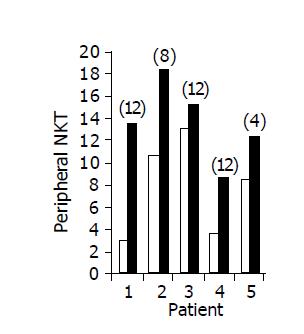
Figure 4 Peripheral NKT lymphocyte percent in 5/10 patients in whom a significant increase was observed during treatment.
Baseline ratio (open bars) as compared to level of maximal increase (black bars, no. of week shown in parenthesis above each bar).
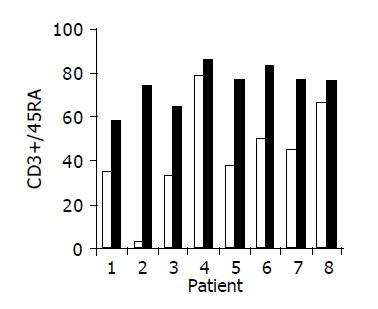
Figure 5 Peripheral CD3+/45RA lymphocyte ratio in 8/10 patients in whom a significant increase was observed during treatment.
Baseline ratio (open bars) as compared to level of maximal increase (black bars).
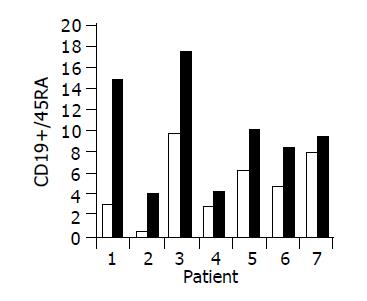
Figure 6 Peripheral CD19+/45RA lymphocyte ratio in 7/10 patients in whom a significant increase was observed during treatment.
Baseline ratio (open bars) as compared to level of maximal increase (black bars).
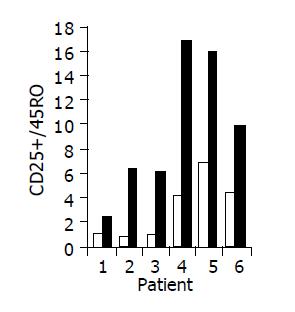
Figure 7 Peripheral CD25+/45RO lymphocyte ratio in 6/10 patients in whom a significant increase was observed during treatment.
Baseline ratio (open bars) as compared to level of maximal increase (black bars).
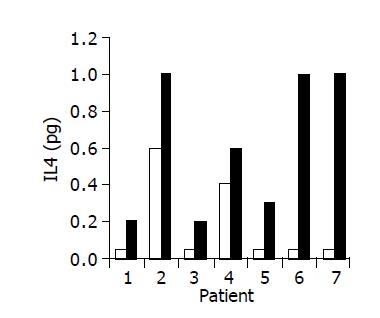
Figure 8 Effect of the study drug on serum IL-4 levels in 7/10 patients in whom a significant increase was observed during treatment.
Baseline ratio (open bars) as compared to level of maximal increase (black bars).
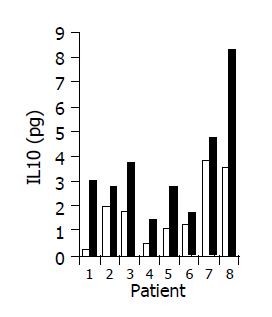
Figure 9 Effect of the study drug on serum IL-10 levels in 8/10 patients in whom a significant increase was observed during treatment.
Baseline ratio (open bars) as compared to level of maximal increase (black bars).
- Citation: Israeli E, Goldin E, Shibolet O, Klein A, Hemed N, Engelhardt D, Rabbani E, Ilan Y. Oral immune regulation using colitis extracted proteins for treatment of Crohn’s disease: Results of a phase I clinical trial. World J Gastroenterol 2005; 11(20): 3105-3111
- URL: https://www.wjgnet.com/1007-9327/full/v11/i20/3105.htm
- DOI: https://dx.doi.org/10.3748/wjg.v11.i20.3105


