Copyright
©2005 Baishideng Publishing Group Co.
World J Gastroenterol. Jan 14, 2005; 11(2): 268-271
Published online Jan 14, 2005. doi: 10.3748/wjg.v11.i2.268
Published online Jan 14, 2005. doi: 10.3748/wjg.v11.i2.268
Figure 1 Pathological changes in rats’ liver by H.
E. staining. 10×10 A: (Control group): The structure of liver lobules was normal, the size and shape of hepatic cells were normal and distributed centrifugally; B: (CCl4 group): The normal structure of lobules was destroyed, and pseudolobules were formed. Liver cells swelled and hepatic lobules were encysted and separated by collagen bundles, and associated with infiltration of inflammatory cells; C: (CCl4+OM group): The normal structure of lobules was also destroyed, pseudolobules formed, and liver cells swelled at a milder extent. The hepatic lobules were encysted and separated by slimmer collagen bundles, with milder infiltration of inflammatory cells.
Figure 2 Observation on reticular collagen by reticular staining.
10×10. A: (Control group): A few fiber tissues were only seen in portal areas; B: (CCl4 group): The pseudolobules were surrounded by strong, multi-layer reticular fibers, which netted into pseudolobules; C: (CCl4+OM group): The pseudolobules were surrounded by slimmer, multi-layer reticular fibers; a significant decrease of reticular fibers was observed in this group, compared with CCl4 group.
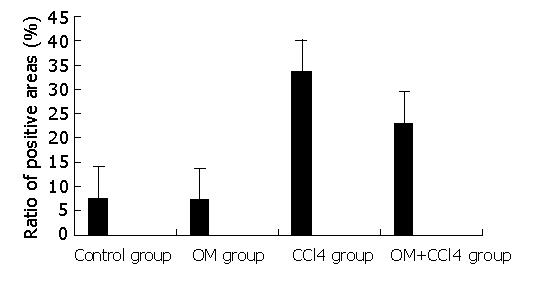
Figure 3 Contents of collagen in livers of rats in different groups.
Figure 4 Expression of TIMP-1antigen by immunohistochemical staining.
10×10 A: (Control group): There was only a weak expression of TIMP-1 antigen in individual liver cells and hepatic stellate cells (HSCs); B: (CCl4 group): The expression of TIMP-1 was detected in cytoplasm of most hepatic cells; C: (CCl4+OM group): There was a significant decline of the expression of TIMP-1 in CCl4+OM group, as compared with that in CCl4 group.
Figure 5 Expression of -SMA antigen by immunohistochemical staining.
10×10 A: (Control group): α-SMA antigen was detected in myofibroblasts and vascular endothelial cells; B: (CCl4 group): The expression of α-SMA was significantly stronger than that in the control groups; C: (CCl4+OM group): The expression of α-SMA was not significantly different from that in CCl4 group.
-
Citation: Shi GF, Li Q. Effects of oxymatrine on experimental hepatic fibrosis and its mechanism
in vivo . World J Gastroenterol 2005; 11(2): 268-271 - URL: https://www.wjgnet.com/1007-9327/full/v11/i2/268.htm
- DOI: https://dx.doi.org/10.3748/wjg.v11.i2.268


