Copyright
©2005 Baishideng Publishing Group Co.
World J Gastroenterol. Jan 14, 2005; 11(2): 242-248
Published online Jan 14, 2005. doi: 10.3748/wjg.v11.i2.242
Published online Jan 14, 2005. doi: 10.3748/wjg.v11.i2.242
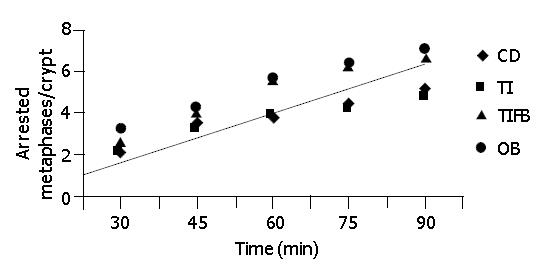
Figure 1 Linear relationship of metaphase arrest to time used to calculate CCPR.
Figure 2 Crypt cell production rate/Crypt/h in caecum at (A), ascending colon (B) and descending colon (C) tissues isolated from experimental and control groups of animals (mean±SE) at 2, 4 and 8 wk treatment.
Significance was seen between CD and the experimental groups TI, TIFB and OB.
Figure 3 Incorporation of [3H] – dThd into the DNA of cecum (A), ascending colon (B) and descending colon (C) tissues at different exposure periods in experimental and control groups (mean±SE).
Significance was seen between CD and the experimental groups TI, TIFB and OB.
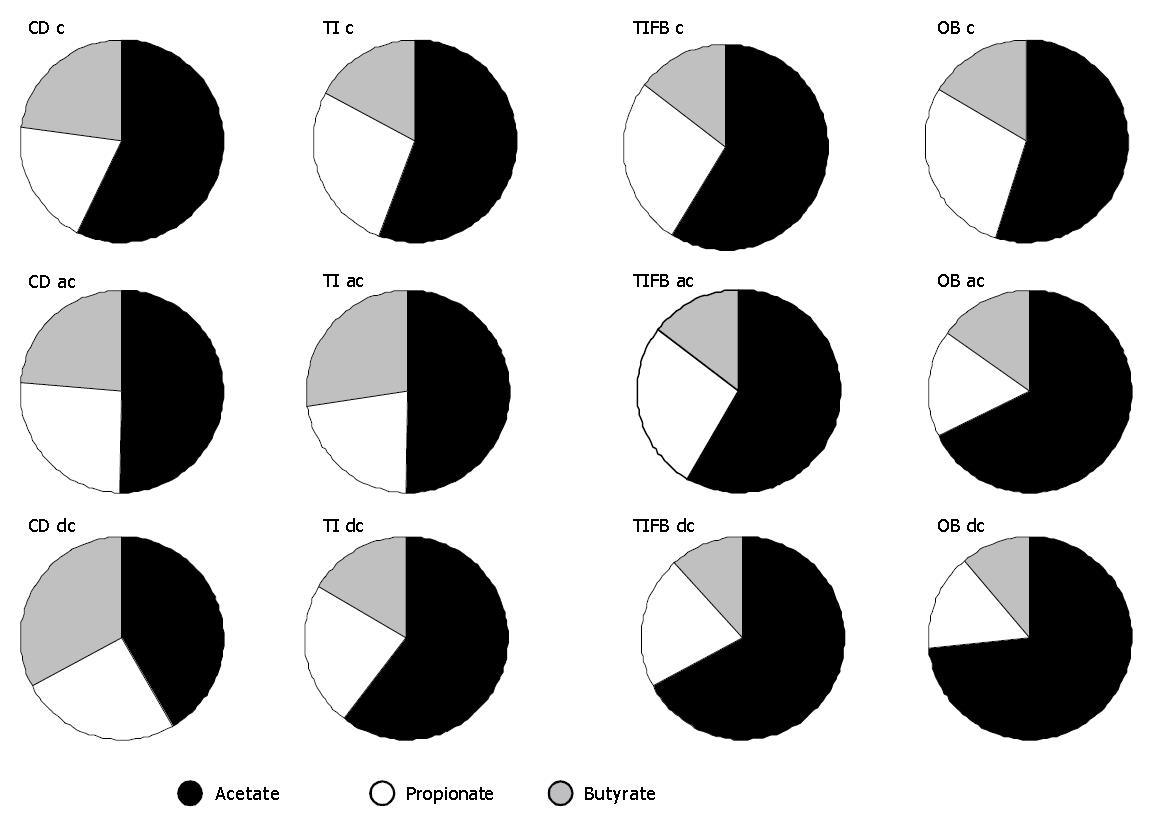
Figure 4 Mean (%) of acetic, propionic and butyric acids in the mucosal contents of cecum (c), ascending colon (ac) and descending colon (dc) tissue segments isolated from mice of CD, TI, TIFB and OB groups.
Results were drawn from the total mean(%) distribution of SCFAs throughout the experimental period (n = 6).
Figure 5 Levels of lactate in mice fed with various dietary factors in CD, TI, TIFB and OB groups for 2, 4 and 8 wk of test periods in the isolated cecum (A), ascending colon (B) and descending colon (C).
Values are represented as μmol/g wet mucosal content, mean±SE.
- Citation: Shivshankar P, Devi SCS. Screening of stimulatory effects of dietary risk factors on mouse intestinal cell kinetics. World J Gastroenterol 2005; 11(2): 242-248
- URL: https://www.wjgnet.com/1007-9327/full/v11/i2/242.htm
- DOI: https://dx.doi.org/10.3748/wjg.v11.i2.242


