Copyright
©2005 Baishideng Publishing Group Co.
World J Gastroenterol. Jan 14, 2005; 11(2): 193-199
Published online Jan 14, 2005. doi: 10.3748/wjg.v11.i2.193
Published online Jan 14, 2005. doi: 10.3748/wjg.v11.i2.193
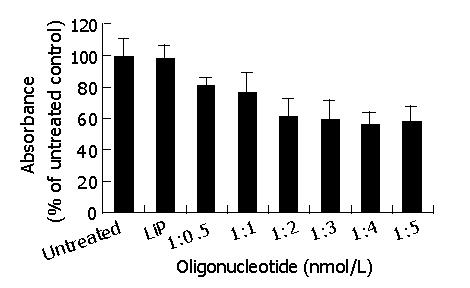
Figure 1 Generation and optimization of antisense compound.
Each value represents the mean±SD of three independent experiments.
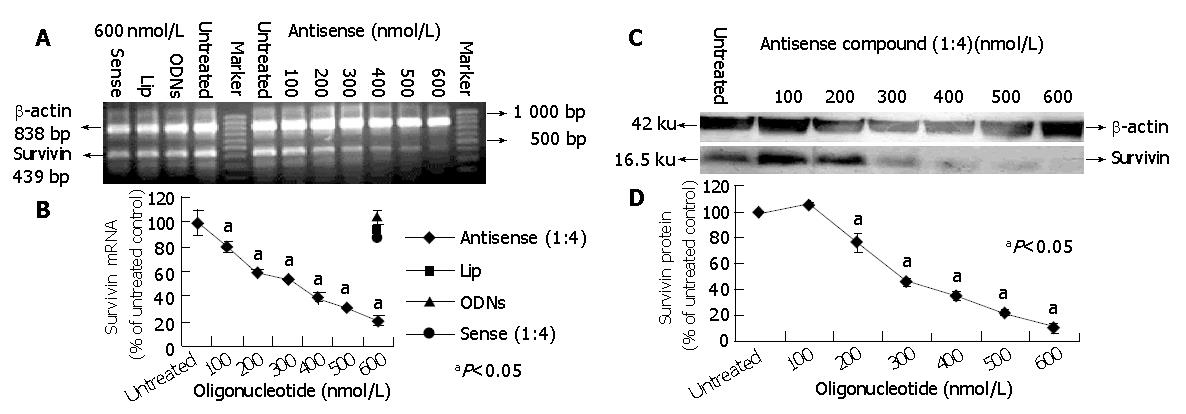
Figure 2 Survivin expression level (mRNA and protein) in HepG2 cells treated with antisense compound (1:4).
A: Sensitivity of survivin mRNA in RT-PCR assay; B: Level of survivin mRNA expression in HePG2; C and D: Western blot analysis of survivin protein expression in HePG2 cells.
Figure 3 Effect of antisense compound (1:4) on the growth and viability of HepG2 cells.
A: Cells incubated with an increasing concentration of antisense compound (1:4), 600 nmol/L sense compound (1:4), 600 nmol/L LiP, or 600 nmol/L (ODNs) for 48-h after the start of transfection; B: untreated cells; C-E: photomicrographs of HepG2 cells after a 48-h transfection with (C) 600 nmol/L antisense comound (1:4), (D) 600 nmol/L sense compound (1:4) or (E) 600 nmol/L LiP.
Figure 4 Anti-active caspase-3 antibodies for measuring apoptosis by flow cytometric analysis.
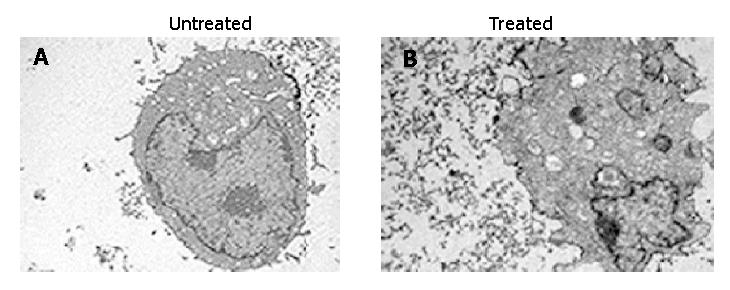
Figure 5 Morphological evaluation of HepG2 cells(original magnification, ×4000).
A: Normal structure in the nuclei and cytoplasm of untreated cell; B: Morphological changes of apoptosis in treated cells.
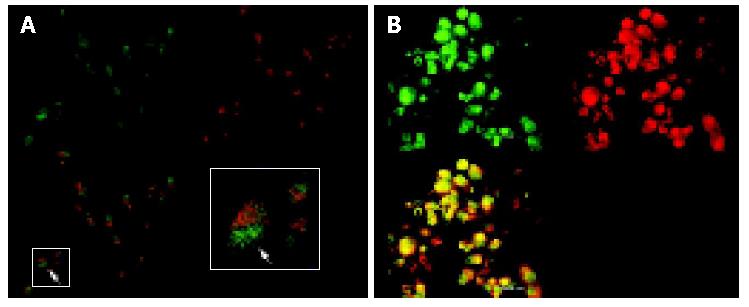
Figure 6 Laser scanning confocal microscopy of localization of survivin protein in HepG2 cells.
A: Expression and localization of endogenous survivin proteins with immunofluorescence analysis of untreated cells by using the polyclonal anti-survivin antibody and FITC-labeled anti-rabbit-IgG as secondary antibody; B: Rare and weakly stained cells treated with antisense compound inside the cytoplasm and morphological changes corresponding to apoptosis.
- Citation: Dai DJ, Lu CD, Lai RY, Guo JM, Meng H, Chen WS, Gu J. Survivin antisense compound inhibits proliferation and promotes apoptosis in liver cancer cells. World J Gastroenterol 2005; 11(2): 193-199
- URL: https://www.wjgnet.com/1007-9327/full/v11/i2/193.htm
- DOI: https://dx.doi.org/10.3748/wjg.v11.i2.193


