Copyright
©2005 Baishideng Publishing Group Co.
World J Gastroenterol. Jan 14, 2005; 11(2): 164-170
Published online Jan 14, 2005. doi: 10.3748/wjg.v11.i2.164
Published online Jan 14, 2005. doi: 10.3748/wjg.v11.i2.164
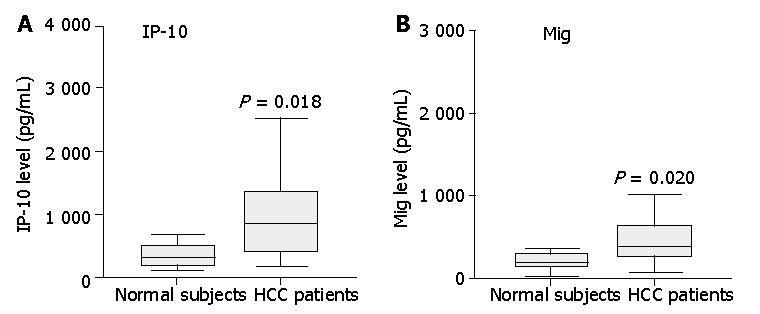
Figure 1 Assay of IP-10 and Mig in serum from 35 patients and 12 healthy controls by cytometric bead array analysis.
Serum levels of IP-10 and Mig in patients with HCC were significantly higher than those of healthy controls. Data are presented as boxplots as medians and the 25th, 75th and 90th percentiles, P<0.05.
Figure 2 Boxplots show significant increase of tumor IP-10 level compared to that of non-tumor liver tissue.
Data are presented as boxplots as medians and the 25th, 75th and 90th percentiles, n = 32, P<0.001.
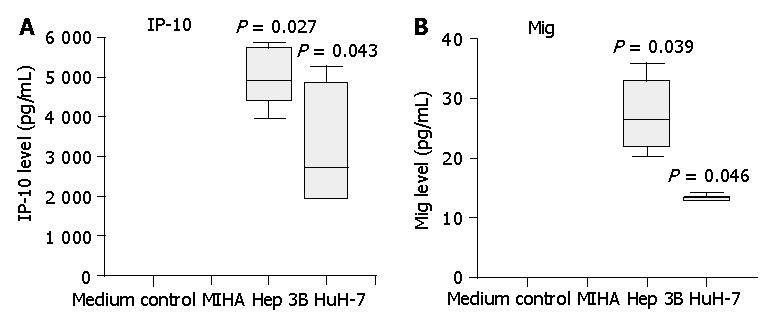
Figure 3 Secretion of IP-10 and Mig by HCC cell lines Hep3B and HuH-7, but not by control liver cell line MIHA.
Three-day cell culture supernatants were collected and IP-10, Mig levels were quantified by cytometric bead array analysis. Significantly higher levels of IP-10 and Mig were detected in HCC cell line supernatants compared with those of control cell line MIHA. Data are presented as boxplots as medians and the 25th, 75th and 90th percentiles, aP<0.05.
Figure 4 Secretion of chemotactic factors by Hep3B cells for lymphocytes from healthy subjects in vitro.
The ability of culture supernatants from Hep3B cells to induce CD4+ (A) and CD8+ (B) T cell chemotaxis was tested by chemotactic experiments as described in Materials and Methods. To test the effect of blocking CXCR3 on the chemotactic response of lymphocytes to Hep3B culture supernatants, lymphocytes were pretreated with anti-CXCR3 monoclonal antibody or IgG control before the chemotaxis assay. Results are expressed as migration index, calculated as described in Materials and Methods.
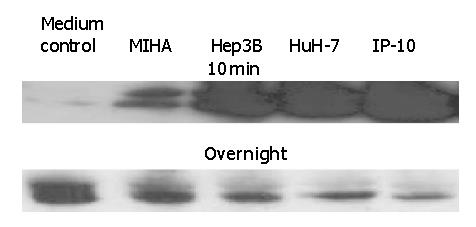
Figure 5 Early activation and later inhibition of ERK phosphorylation induced by tumor cell culture supernatants in lymphocytes from normal controls.
A total of 5×10⁶ freshly isolated lymphocytes were incubated with 500 μL of culture supernatants or IP-10 at 100 nmol/L in a 37 °C incubator for either 10 min or overnight. The cells were lysed and ERK phosphorylation was determined by Western blotting. The SDS-PAGE profile represents one experiment out of three.
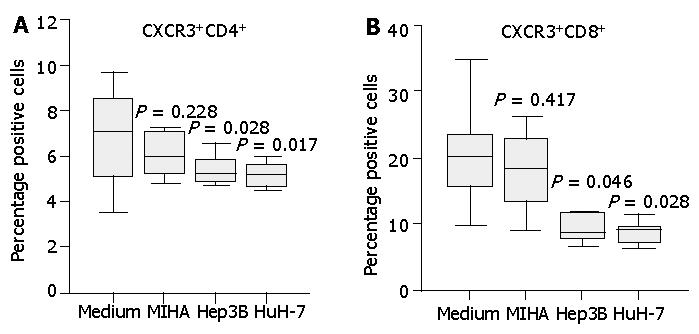
Figure 6 Expression of CXCR3 on normal CD4+ or CD8+ T cells incubated with unconditioned medium or medium conditioned with the tumor cell lines or a control cell line.
Cell culture supernatants conditioned for 3 d by the HCC cell lines Hep3B, HuH-7 or the control cell line MIHA were collected. Freshly isolated normal PBLs were incubated in unconditioned or conditioned medium for 20 h and T cell expression of CXCR3 was assessed by flow cytometry. Diminished CXCR3 expression on CD4+ T cells (A) and CD8+ T cells (B) was observed following incubation in HCC cell line supernatants whilst the control cell line supernatant had no significant effect. Data represent the median and the 25th, 75th and 90th percentiles, n = 8, aP<0.05 vs medium control.
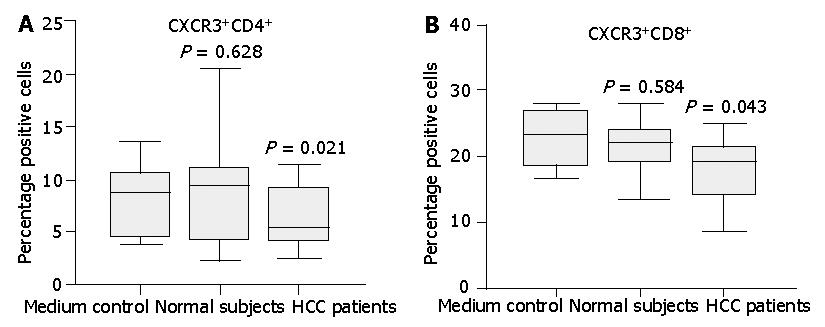
Figure 7 Expression of CXCR3 on normal CD4+ or CD8+ T cells incubated with medium supplemented with 10% serum from either HCC patients or normal subjects.
Normal T cells cultured in the full medium with 10% FCS served as medium control. After 24 h, surface expression of CXCR3 on T cells was assessed by flow cytometry. Diminished CXCR3 expression on CD4+ T cells (A) and CD8+ T (B) cells was observed after incubation with HCC patient serum compared with normal serum. Data represent the median and the 25th, 75th and 90th percentiles, n = 9, aP<0.05.
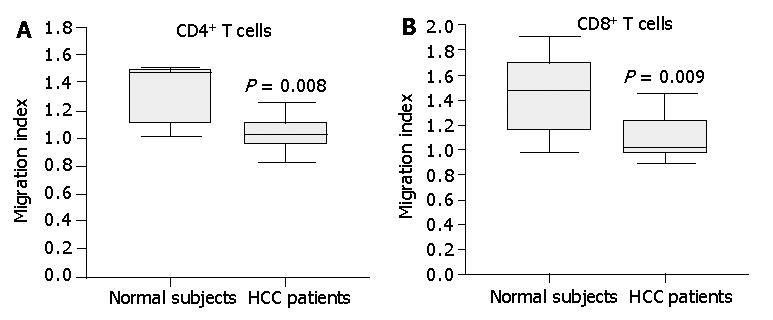
Figure 8 Chemotactic responsiveness of CD4+ T cells and CD8+T cells to IP-10.
CD4+ T cells and CD8+T cells from HCC patients did not exhibit a significant chemotactic response toward IP-10 compared to CD4+ T cells and CD8+T cells from normal subjects. Results are expressed as migration index, calculated as described in Materials and Methods. Data are the median and the 25th, 75th and 90th percentiles, n = 7, aP<0.05.
- Citation: Liu YQ, Poon RT, Hughes J, Li QY, Yu WC, Fan ST. Desensitization of T lymphocyte function by CXCR3 ligands in human hepatocellular carcinoma. World J Gastroenterol 2005; 11(2): 164-170
- URL: https://www.wjgnet.com/1007-9327/full/v11/i2/164.htm
- DOI: https://dx.doi.org/10.3748/wjg.v11.i2.164


