Copyright
©2005 Baishideng Publishing Group Inc.
World J Gastroenterol. May 21, 2005; 11(19): 2953-2955
Published online May 21, 2005. doi: 10.3748/wjg.v11.i19.2953
Published online May 21, 2005. doi: 10.3748/wjg.v11.i19.2953
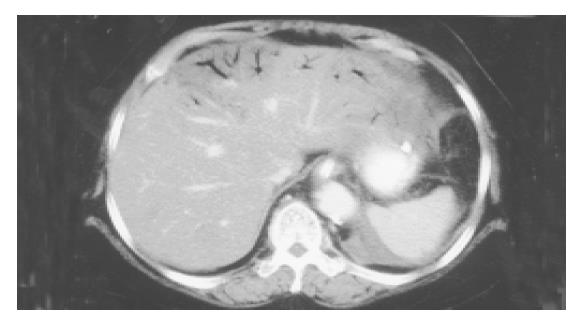
Figure 1 Contrast-enhanced abdominal CT at celiac axis level shows evidence of HPVG.
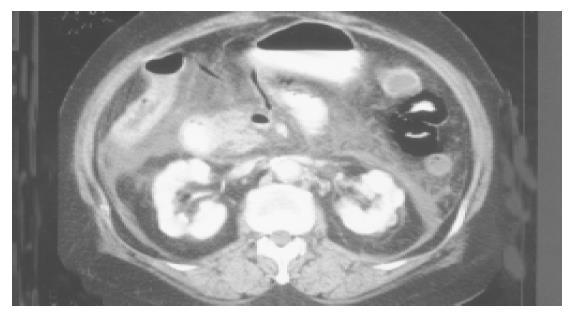
Figure 2 Contrast-enhanced abdominal CT at renal hilar level shows tubular dry gases (arrow) and air-fluid level (arrowhead) within the mesenteric veins.
Pneumatosis intestinalis and inflammation fluid collection in the left pararenal space indicating that pancreatitis is also observed.
- Citation: Chan SC, Wan YL, Cheung YC, Ng SH, Wong AMC, Ng KK. Computed tomography findings in fatal cases of enormous hepatic portal venous gas. World J Gastroenterol 2005; 11(19): 2953-2955
- URL: https://www.wjgnet.com/1007-9327/full/v11/i19/2953.htm
- DOI: https://dx.doi.org/10.3748/wjg.v11.i19.2953


