Copyright
©2005 Baishideng Publishing Group Inc.
World J Gastroenterol. May 21, 2005; 11(19): 2912-2915
Published online May 21, 2005. doi: 10.3748/wjg.v11.i19.2912
Published online May 21, 2005. doi: 10.3748/wjg.v11.i19.2912
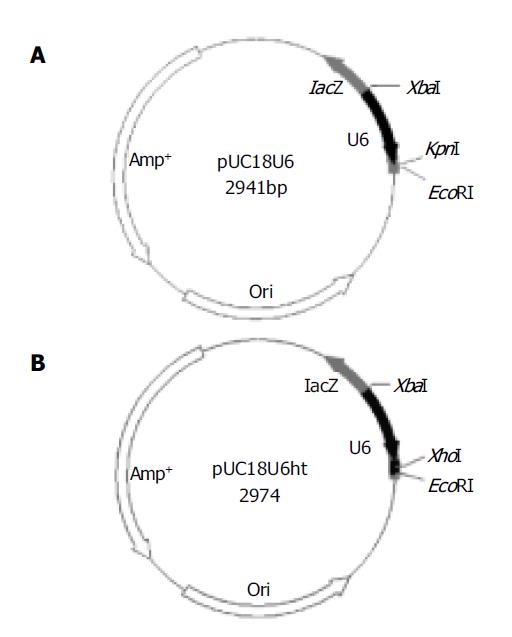
Figure 1 Maps of pUC18U6 and pUC18U6ht.
A: pUC18U6. B: pUC18U6ht.
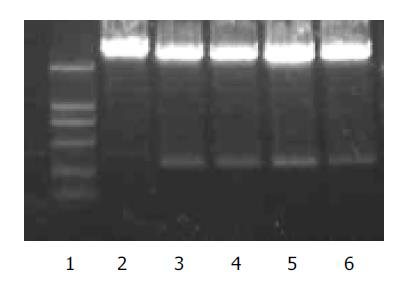
Figure 2 Restriction digestion analysis of recombinant vector pUC18U6ht.
1: DNA marker (2000, 1000, 750, 500, 250, 100 bp from top to bottom); 2: pUC18U6; 3-6: pUC18U6ht1-4, respectively.
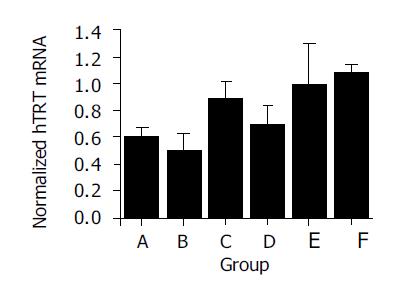
Figure 3 Normalized hTERT mRNA of transfected HepG2 cells.
Groups A-F represent HepG2 cells transfected by pUC18U6ht1, pUC18U6ht2, pUC18U6ht3, pUC18U6ht4, pUC18U6, and pUC18U6GFPsir, respectively (n = 3 for each group). Normalized hTERT mRNA levels of HepG2 cells transfected by pUC18U6ht1 and pUC18U6ht2 were reduced by 39% and 49%, respectively, as compared with that of HepG2 cells transfected by pUC18U6.
- Citation: Guo Y, Liu J, Li YH, Song TB, Wu J, Zheng CX, Xue CF. Effect of vector-expressed shRNAs on hTERT expression. World J Gastroenterol 2005; 11(19): 2912-2915
- URL: https://www.wjgnet.com/1007-9327/full/v11/i19/2912.htm
- DOI: https://dx.doi.org/10.3748/wjg.v11.i19.2912


