Copyright
©2005 Baishideng Publishing Group Inc.
World J Gastroenterol. May 21, 2005; 11(19): 2906-2911
Published online May 21, 2005. doi: 10.3748/wjg.v11.i19.2906
Published online May 21, 2005. doi: 10.3748/wjg.v11.i19.2906
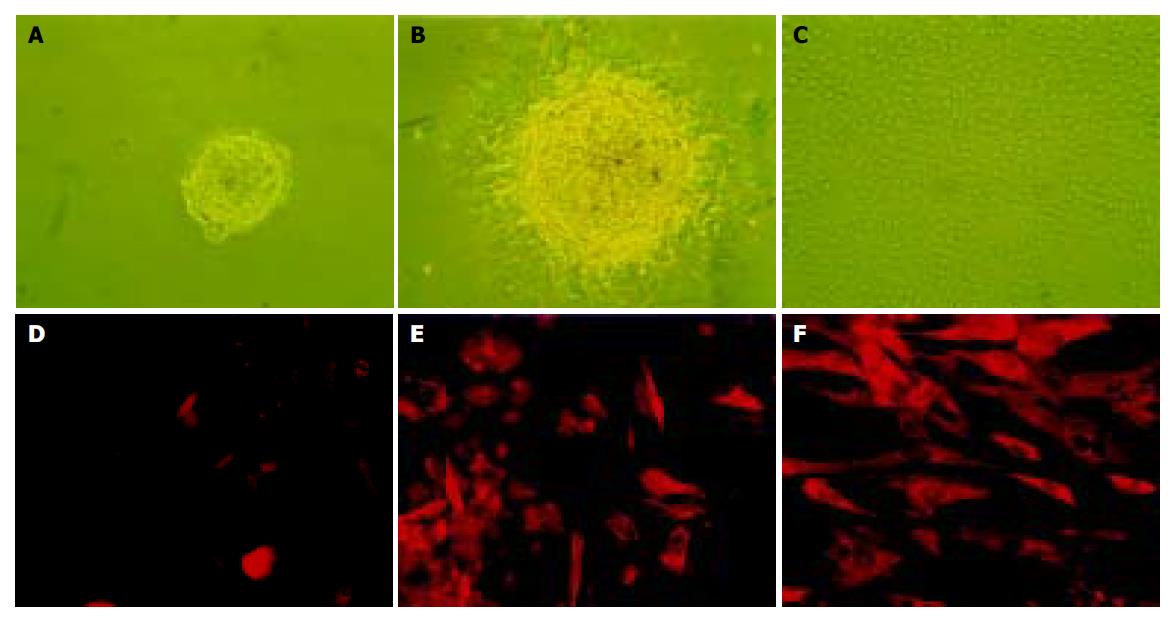
Figure 1 The culture (A-C) and immunofluorescence staining (D-F) of nestin-positive cells isolated from human fetal pancreas.
A: The free-floating ICCs isolated from fetal human pancreas; B: After pipetted out and cultured in a new dish, the ICCs attached to the bottom and a monolayer of epithelium-like cells spread out; C: The epithelium-like cells making confluent sheet, the ICCs disappeared structurally (×100); D: Negative control using mouse IgG to substitute the primary antibody; E: Nestin expressed in some of the epithelium-like cells spreading out from ICCs. F: Expression of nestin in most of the epithelium-like cells passaged 10 times (×200).
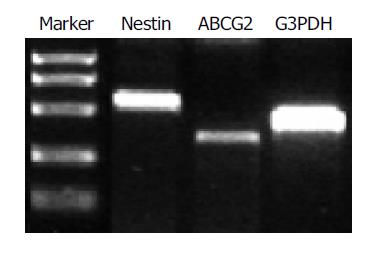
Figure 2 RT-PCR analysis of nestin (549 bp) and ABCG2 (342 bp) expression in the cultured cells.
G3PDH (452 bp) served as internal control.
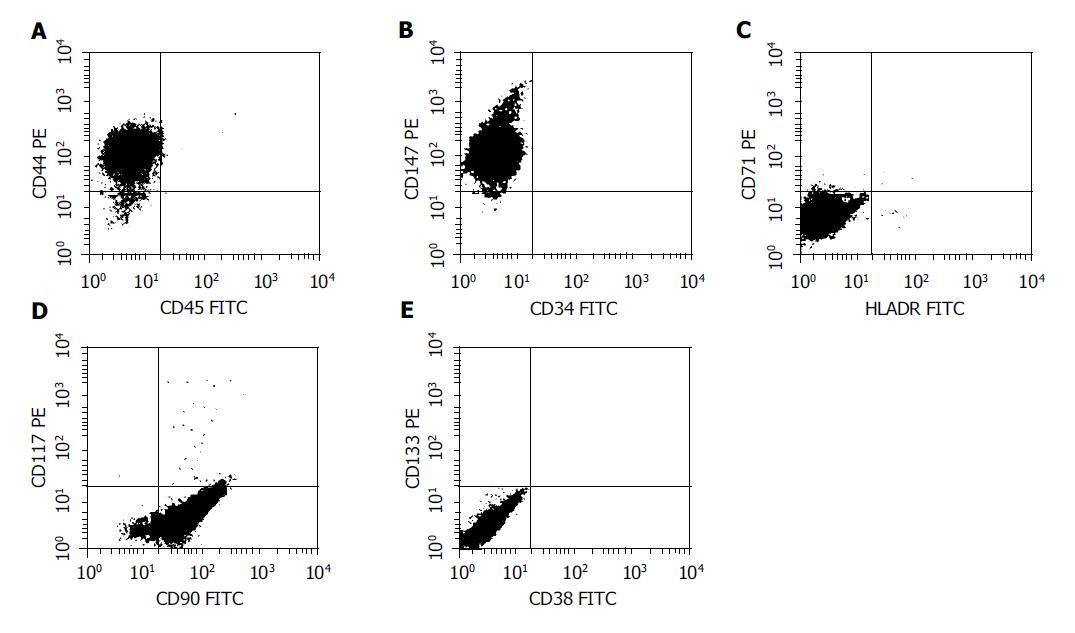
Figure 3 FACS analysis of the surface marker in the nestin-positive cells.
The cells were labeled with FITC- or PE-conjugated antibodies and then analyzed in a flow cytometer. CD44, CD90 and CD147 were positive, whereas CD34, CD38, CD45, CD71, CD117, CD133 and HLA-DR were negative in the cells, resembling the phenotype of mesenchymal stem cells.
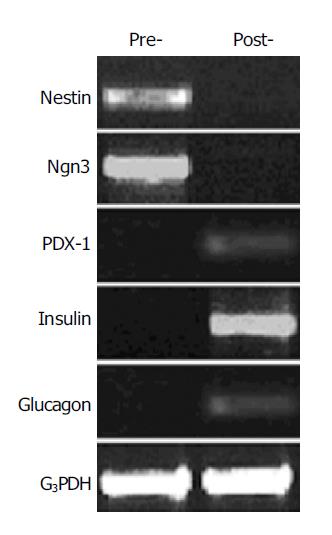
Figure 4 RT-PCR analysis of gene expression change in the nestin-positive cells before and after induction by using the primers for nestin (549 bp), Ngn3 (420 bp), PDX-1 (262 bp), insulin (261 bp), and glucagon (236 bp).
G3PDH were used as internal control (452 bp). Pre-, cells before induction; post-, cells after induction.
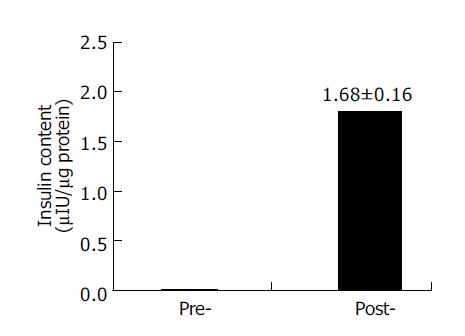
Figure 5 RIA detection of intra-cellular insulin content before and after induction.
Data are the mean±SD of three separate experiments with the nestin-positive cells. Pre-, the cells before induction; post-, the cells after induction.
- Citation: Zhang L, Hong TP, Hu J, Liu YN, Wu YH, Li LS. Nestin-positive progenitor cells isolated from human fetal pancreas have phenotypic markers identical to mesenchymal stem cells. World J Gastroenterol 2005; 11(19): 2906-2911
- URL: https://www.wjgnet.com/1007-9327/full/v11/i19/2906.htm
- DOI: https://dx.doi.org/10.3748/wjg.v11.i19.2906


