Copyright
©2005 Baishideng Publishing Group Inc.
World J Gastroenterol. May 21, 2005; 11(19): 2900-2905
Published online May 21, 2005. doi: 10.3748/wjg.v11.i19.2900
Published online May 21, 2005. doi: 10.3748/wjg.v11.i19.2900
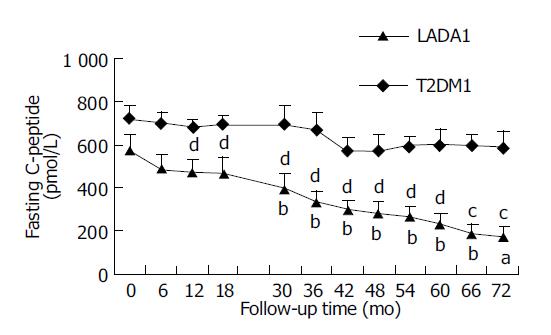
Figure 1 Changes of FCP level in LADA1 and T2DM1 patients during the 6-year follow-up time.
Values are mean±SE of 16 patients respectively. The lower line shown here is representative of LADA patients and the upper one of T2DM group’s. The FCP of LADA1, decreasing much quicker than that of T2DM1 patients, declined significantly from the 30th mo compared with the entry (aP<0.05, bP<0.01). And from the 12th mo, the difference of FCP between LADA1 and T2DM1 patients became significant until the end of follow-up time (cP<0.05, dP<0.01). Meanwhile T2DM1 group did not show any significant decrease during the follow-up period (P>0.05).
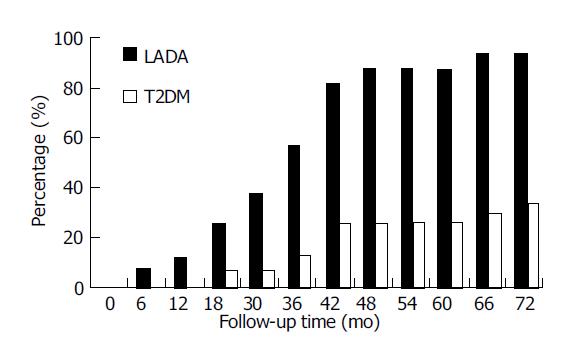
Figure 2 The percentage of patients whose FCP decreased more than 50% compared with the baseline during the follow-up time.
Black bar graph representing the percentage of LADA patients, which showed us a much quicker increase from 6.25% at 6th mo to 25.0% at 18th mo until 93.8% at 72th mo. Meanwhile in the white bar of T2DM group, the percentage increased much slower and only to 30.0% at the end of follow-up.
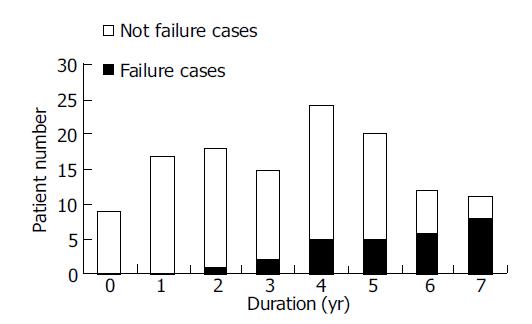
Figure 3 The failure of islet function during the follow-up in LADA patients.
The number of patients with β cell failure increased from 0/9 (new onset) to 1/18 (2-year duration), 2/15 (3-year duration), 5/24 (4-year duration), 5/20 (5-year duration), 6/12 (6-year duration) and 8/11 (7-year duration). The average time for β cell failure was 4.4±1.9 years.
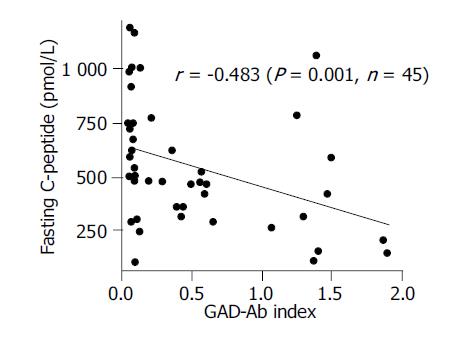
Figure 4 Correlation of FCP level and GAD-Ab index in LADA patients.
The X-axis represented GAD-Ab index that ranged from 0.05 to 1.91 and the Y-axis showed the FCP that ranged from 111 to 1 194 pmol/L of 45 LADA patients at enrollment. The scatter diagram showed us that these two factors were negatively correlated (r = -0.483, P = 0.001), which meant that the LADA patients with much higher GAD-Ab titer would face more risk of islet function failure.
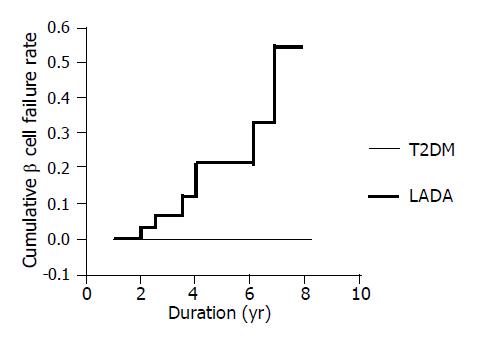
Figure 5 Survival analysis of the cumulative failure rates of islet β cell function in LADA and T2DM patients during the follow-up period.
The X-axis represented the duration of diabetes and Y-axis meant the cumulative proportion of β cell failure in these patients. Patient that developed β cell failure would be supposed as “dead”, otherwise, as “survival” at different period of duration (called “survival time”). The dotted and the solid line represented LADA and T2DM patients respectively. The β cell failure cumulative rate increased from 0.074 at the 2nd year to 0.462 at the 8th year of duration in LADA patients; however, that of T2DM remained unchangeable in the whole period.
- Citation: Yang L, Zhou ZG, Huang G, Ouyang LL, Li X, Yan X. Six-year follow-up of pancreatic β cell function in adults with latent autoimmune diabetes. World J Gastroenterol 2005; 11(19): 2900-2905
- URL: https://www.wjgnet.com/1007-9327/full/v11/i19/2900.htm
- DOI: https://dx.doi.org/10.3748/wjg.v11.i19.2900


