Copyright
©2005 Baishideng Publishing Group Inc.
World J Gastroenterol. May 21, 2005; 11(19): 2874-2884
Published online May 21, 2005. doi: 10.3748/wjg.v11.i19.2874
Published online May 21, 2005. doi: 10.3748/wjg.v11.i19.2874
Figure 1 Analysis by SSCP+HDA of the E2 region (including the HVR1) of HCV in two HCV-positive IDUs.
Clonotypes (groups of electrophoretically indistinguishable cloned cDNAs) were assigned sequential letter designations (a-p). As can be seen, the number of clonotypes in patient with clearance of viremia (PA) E did not differ significantly after antibody seroconversion compared with the pre-antibody seroconversion sample, and the clonotypes composition remained largely unchanged during the follow-up. In contrast, the number of clonotypes increased in patient with persistent viremia (PC) C, and the clonotypes composition showed constant evolution during the follow-up.
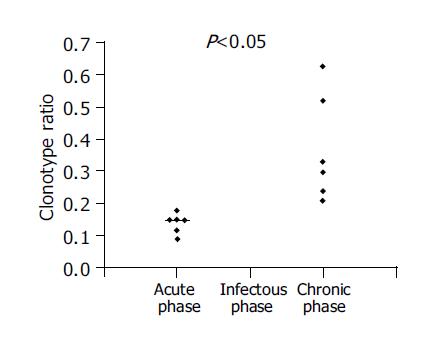
Figure 2 Clonotype ratio and outcome.
Clonotype ratio values obtained for the samples from five individuals at each time point were calculated as described in Materials and methods.
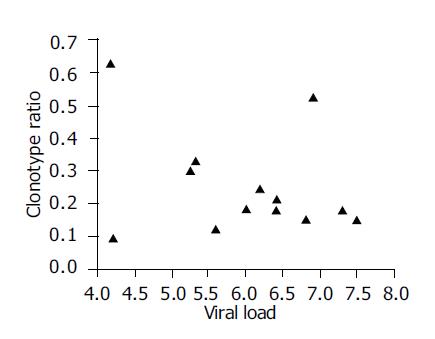
Figure 3 Correlation between HCV clonotype ratio and serum HCV RNA load.
No correlation was found between them (r = 0.2).
Figure 4 Alignment of nucleotide sequences of E1 and the 5’ half of E2 including HVR1 for the majority sequences and each sequence from each subject A, B, C, E and F at different time points.
In the first column, alphabetical labels indicate different samplings, while in the last column the numbers indicate the number of cloned cDNAs (out of 33 assessed for each sample) with SSCP+HD pattern. Dashes indicate identity to the nucleotide at the position in the first sequence.
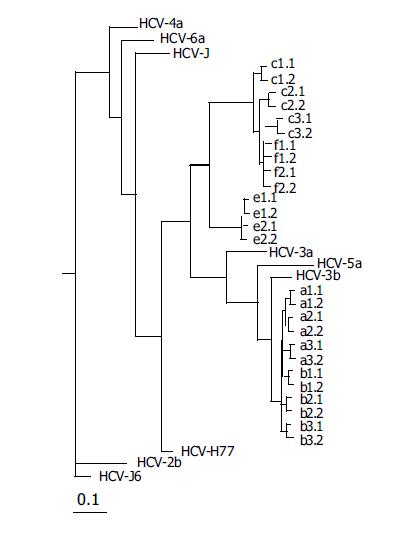
Figure 5 Unrooted tree showing the diversity of 384-nt E2 sequences from subjects.
Letters represent individuals who cleared viremia (e and f) and those with persistent viremia (a-c), and lowercase numbers indicate the different clones obtained. The number and line at the bottom denote the proportion of nucleotides substituted for a given horizontal branch length. Dendrograms were produced using the Neighbor-joining program.
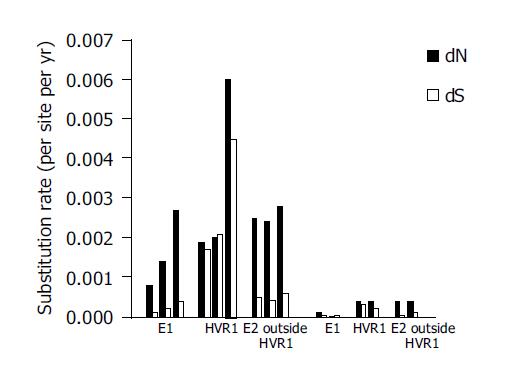
Figure 6 Nonsynonymous rate and synonymous rates of mutations for the E1, HVR1 and E2 regions outside HVR1 from five individuals.
- Citation: Chen S, Wang YM. Multigene tracking of quasispecies in viral persistence and clearance of hepatitis C virus. World J Gastroenterol 2005; 11(19): 2874-2884
- URL: https://www.wjgnet.com/1007-9327/full/v11/i19/2874.htm
- DOI: https://dx.doi.org/10.3748/wjg.v11.i19.2874


