Copyright
©2005 Baishideng Publishing Group Inc.
World J Gastroenterol. May 21, 2005; 11(19): 2858-2863
Published online May 21, 2005. doi: 10.3748/wjg.v11.i19.2858
Published online May 21, 2005. doi: 10.3748/wjg.v11.i19.2858
Figure 1 Gp96 expressed in E.
coli and purification from normal murine livers. A and B: Elutions of gp96 from POROS 20QE column with 300-800 mmol/L NaCl were detected by SDS-PAGE. The gp96 expressed in E.coli. A: or purified from mice livers; B: were collected as 1 mL fractions during the purification on POROS 20QE column and a total of six individual fractions (lanes 1-6) were run on the SDS-PAGE gel with Coomassie blue staining afterwards; C: Gel-filtration analysis of gp96 purified from mice livers. The protein samples are run on Superdex G200 column; D: Proteins collected from the peak of gel filtration were run on 10% SDS-PAGE and Western blot are shown on the right.
Figure 2 Expression and purification of the N-terminal fragment of gp96 in the GST fusion expression system.
A: The resulting protein N-terminal fragment of gp96 (named after NTF) was separated from the digestion product on a glutathione±Sepharose 4B column to remove GST and GST-3C protease. Lane 1, 10% SDS±PAGE of GST-NTF eluted by reduced glutathione; lane 2, NTF after GST-3C protease digestion (16 h, 5 °C); lane 3, NTF after removing GST and GST-3C protease; lane 4, purified GST as control; M, protein molecular weight markers as indicated in kilo Daltons; B: Gel-filtration analysis of NTF protein. NTF protein subjected to Superdex G75 gel-filtration; C: The proteins from the peak run on 10% SDS-PAGE and Western blot. The standard proteins are superimposed in both A and C.
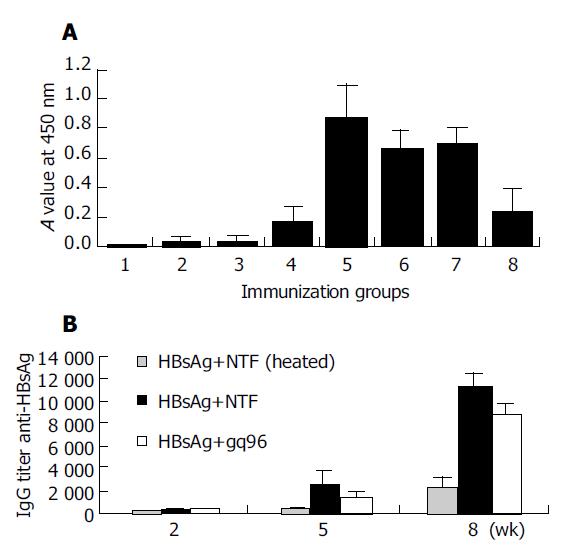
Figure 3 Induced humoral immune response in Balb/c mice.
A: Groups (eight mice per group) of Balb/c mice were immunized with different gradient: group 1, PBS only; group 2, 10 μg gp96 only; group 3, 10 μg NTF only; group 4, 10 μg HBsAg only; group 5, 10 μg HBsAg+10 μg NTF; group 6, 10 μg HBsAg+10 μg gp96; group 7, 10 μg HBsAg+IFA; group 8, 10 μg HBsAg+10 μg NTF (95 °C heated for 30 min) at d 0 (day of first vaccination). At d 21, and 42 mice were re-immunized with the same material. At d 63 anti-HBsAg antibodies from different groups were compared using the value at 450 nm absorbance. The values of antibody were expressed as geometry mean±SD; B: Sera from the mice immunized with HBsAg plus heated NTF, HBsAg plus NTF or gp96 (groups 5, 6 and 8) were collected on d 14, 35 and 64 from first vaccination and stored at -20 °C and titers at different dilution were tested at the same time.
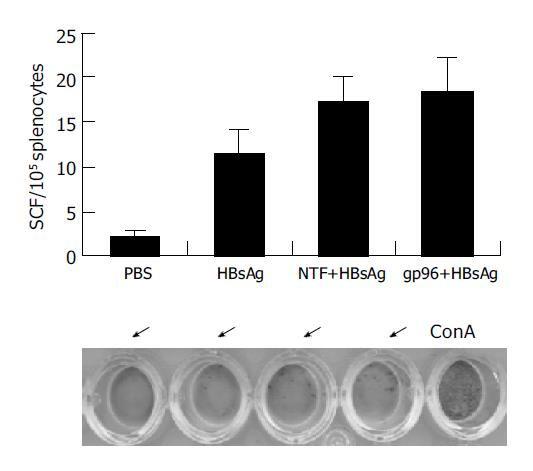
Figure 4 T-cell response of splenocytes of immunized Balb/c mice.
Mice immunized with PBS, HBsAg plus heated NTF, HBsAg plus NTF or gp96 (the same groups as groups 5, 6, and 8 respectively in Figure 3) were killed on d 63 and the splenocytes were collected for ELISPOT assay with 105 cells per well. The number of SFCs was calculated. The photograph of the representative wells from different groups is shown below the statistics.
- Citation: Li HT, Yan JB, Li J, Zhou MH, Zhu XD, Zhang YX, Tien P. Enhancement of humoral immune responses to HBsAg by heat shock protein gp96 and its N-terminal fragment in mice. World J Gastroenterol 2005; 11(19): 2858-2863
- URL: https://www.wjgnet.com/1007-9327/full/v11/i19/2858.htm
- DOI: https://dx.doi.org/10.3748/wjg.v11.i19.2858


