Copyright
©The Author(s) 2004.
World J Gastroenterol. Feb 15, 2004; 10(4): 509-513
Published online Feb 15, 2004. doi: 10.3748/wjg.v10.i4.509
Published online Feb 15, 2004. doi: 10.3748/wjg.v10.i4.509
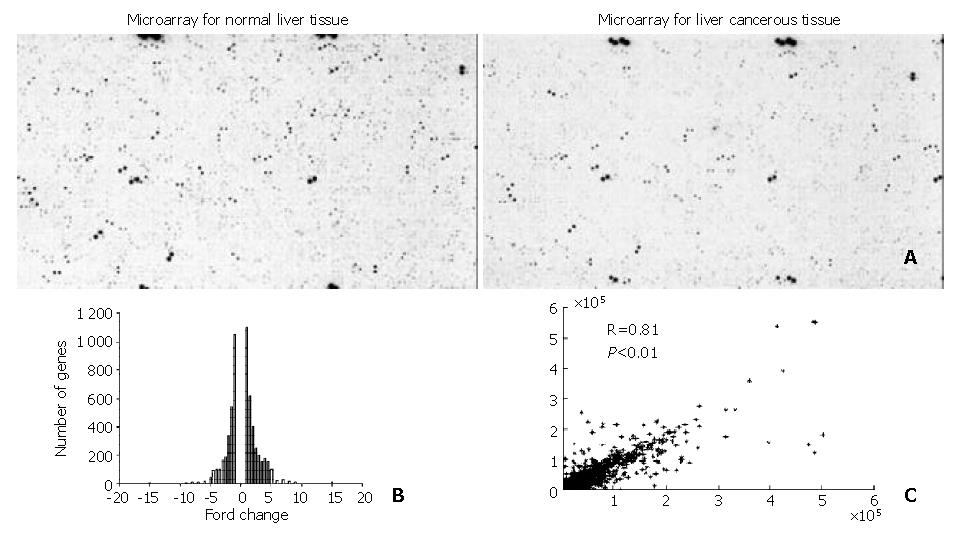
Figure 1 Parallel analysis of gene expression in paired human liver tumor sample (A).
Histogram analysis of fold change in differentially expressed genes in cDNA microarray (B). Scatterplot of two cDNA microarray analyses of normal liver and liver tumor samples. Each point stands for a gene with the X coordinate value as the gene expression level in the normal liver microarray and the Y coordinate value as the gene expression level in the liver tumor microarray. A R of 0.81 was produced and suggested high reliability of the experiments (C).
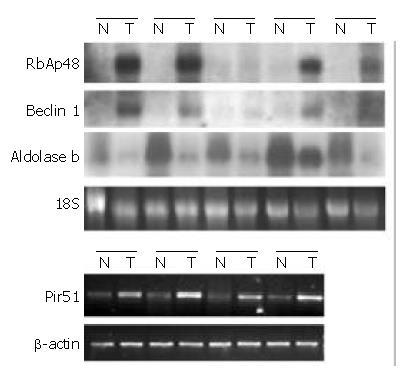
Figure 2 Northern blots of RbAp48, Beclin 1 and aldolase b genes in paired liver tumor (T) and normal liver tissues (N).
RT-PCR analysis of Pir51 in the same paired HCC samples. 18S rRNA shown as a loading control.
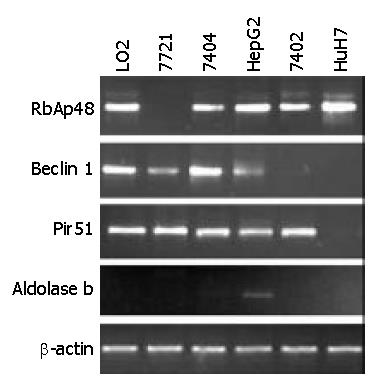
Figure 3 RT-PCR analysis of RbAp48, Beclin 1, Pir51 and al-dolase b expression in one hepato (L02) and 5 hepatoma cell lines (SMMC-7721, Bel-7404, HepG2, Bel-7402, HuH7).
β-actin was shown as an internal control.
- Citation: Song H, Xia SL, Liao C, Li YL, Wang YF, Li TP, Zhao MJ. Genes encoding Pir51, Beclin 1, RbAp48 and aldolase b are up or down-regulated in human primary hepatocellular carcinoma. World J Gastroenterol 2004; 10(4): 509-513
- URL: https://www.wjgnet.com/1007-9327/full/v10/i4/509.htm
- DOI: https://dx.doi.org/10.3748/wjg.v10.i4.509


