Copyright
©The Author(s) 2004.
World J Gastroenterol. Dec 15, 2004; 10(24): 3564-3568
Published online Dec 15, 2004. doi: 10.3748/wjg.v10.i24.3564
Published online Dec 15, 2004. doi: 10.3748/wjg.v10.i24.3564
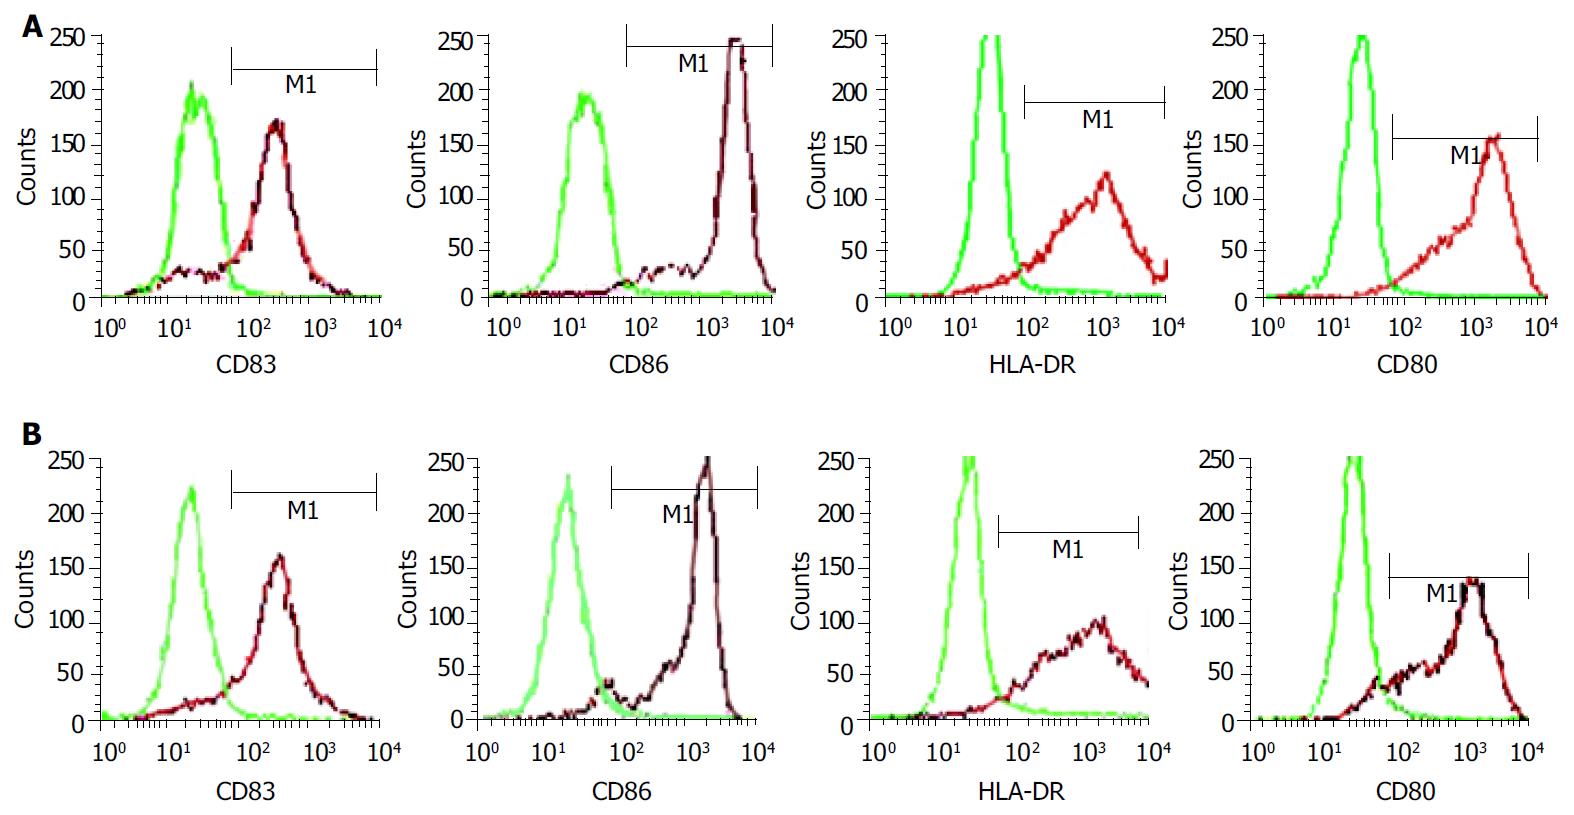
Figure 1 FACS analysis of activation markers on FastDCs and novel dendritomas.
A: Expression of DCs activation markers on FastDCs determined by FACS. B: DCs activation markers expressing on novel dendritomas determined by FACS.
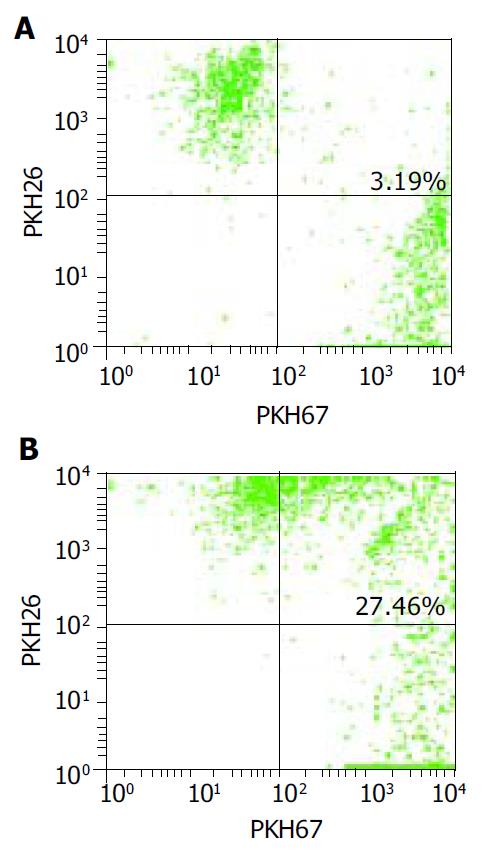
Figure 2 Fusion efficiency analysis by FACS.
A: Control group (mixture): 3.19% dual-fluorescent cells. B: Fusion group: 27.46% dual-fluorescent cells.
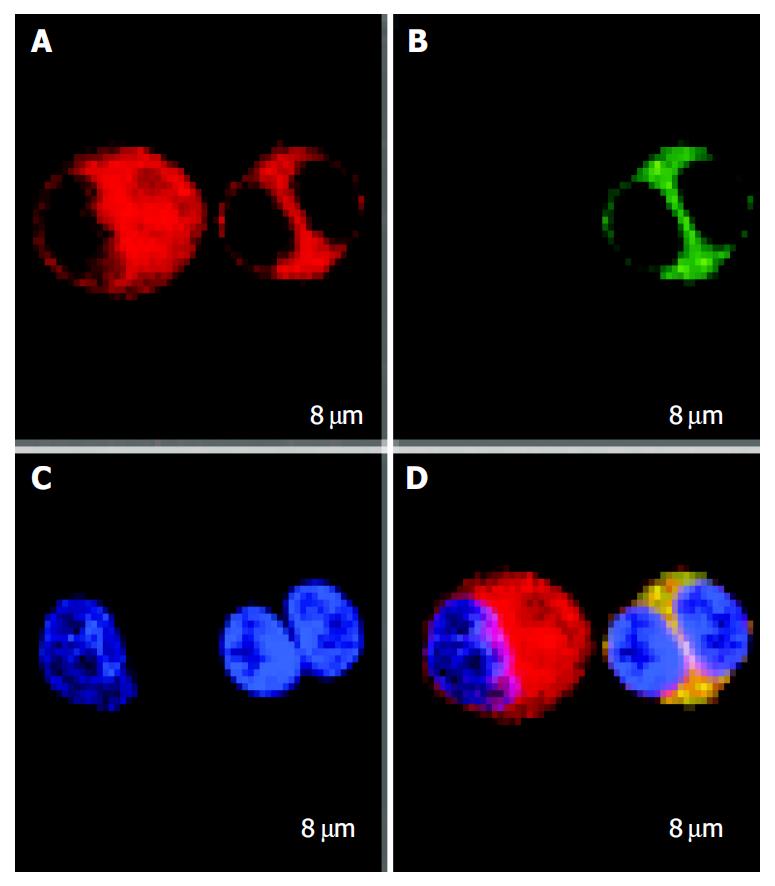
Figure 3 Images of novel dendritomas and HCCLM3 cells under confocal laser scanning microscopy.
A: Red tumor and dendritoma cells. B: Green dendritoma cells. C: One dendritoma cell with two blue nuclei and one tumor cell with one nucleus. D: One dendritoma cell (right) characteristic of a dual-fluores-cent cell with two blue nuclei while one red fluorescent tu-mor cell (left) with one nucleus.
-
Citation: Guan X, Peng JR, Yuan L, Wang H, Wei YH, Leng XS. A novel, rapid strategy to form dendritomas from human dendritic cells and hepatocellular carcinoma cell line HCCLM3 cells using mature dendritic cells derived from human peripheral blood CD14+ monocytes within 48 hours of
in vitro culture. World J Gastroenterol 2004; 10(24): 3564-3568 - URL: https://www.wjgnet.com/1007-9327/full/v10/i24/3564.htm
- DOI: https://dx.doi.org/10.3748/wjg.v10.i24.3564


