Copyright
©The Author(s) 2004.
World J Gastroenterol. Dec 1, 2004; 10(23): 3522-3527
Published online Dec 1, 2004. doi: 10.3748/wjg.v10.i23.3522
Published online Dec 1, 2004. doi: 10.3748/wjg.v10.i23.3522
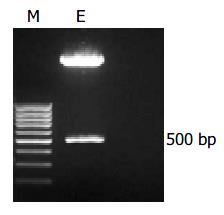
Figure 1 Restriction enzyme digestions of the plasmids.
Lane M: markers (the brightest band of the marker presents the 500 bp); lane E: one of the split bands emerged at the exact position of 500 bp, and the other was the empty pcDNA3.0 vector as expected.
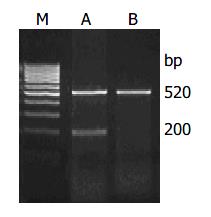
Figure 2 Confirmation of the successful transfection of HBx into HepG2 cells by RT-PCR.
Lane M: markers (the brightest band of the marker presents the 500 bp); lane A: transfected cells; lane B: transfected cells treated with U0126; lane C: the control.
Figure 3 Western blot analysis of HBx protein in samples isolated from HepG2 cells with or without HBx transfection.
Lane 1: the sample transfected with HBx; lane 2: the sample transfected with vector only.
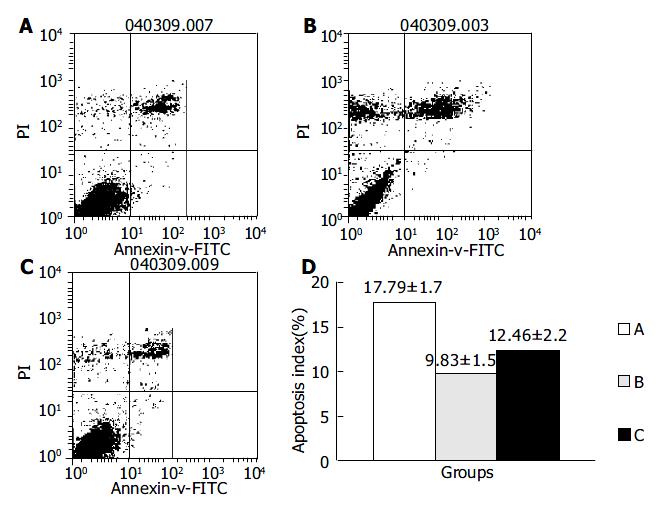
Figure 4 Apoptosis index of three different groups of cells after treatment with 5-Fu.
A: HepG2/pcDNA3 cells; B: HepG2/ pcDNA3-HBx cells; C: U0126 pretreated transfected cells. D: Apoptotic index quantitated by FACS.
Figure 5 Protein levels of MDR associated genes in different groups of cells.
Lane1: HepG2/pcDNA3 cells; lane2: HepG2/pcDNA3-HBx cells; lane3: transfected cells treated with U0126. The primary antibody for A, B, C, D was β -actin, MDR-1, MRP-1 and LRP respectively.
Figure 6 RT-PCR analysis of the expression of MDR associated genes in transfected and control cells.
Lane 1: HBx-expressing cells; lane 2: control cells; lane M: markers. A: Specific primers to amplify MDR-1 gene; B: Specific primers to amplify MRP-1 gene; C: Specific primers to amplify LRP gene.
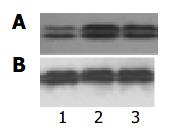
Figure 7 Increased phosphorylation of ERK induced by HBx in hepatoma cells analyzed by Western blot.
Lane 1: trans-fected cells after treated with U0126; lane 2: HBx-expressing cells ; lane 3: control cells. A: Specific antibody for phosphory-lated-ERK; B: Specific antibody for total ERK.
- Citation: Guan J, Chen XP, Zhu H, Luo SF, Cao B, Ding L. Involvement of extracellular signal-regulated kinase/mitogen-activated protein kinase pathway in multidrug resistance induced by HBx in hepatoma cell line. World J Gastroenterol 2004; 10(23): 3522-3527
- URL: https://www.wjgnet.com/1007-9327/full/v10/i23/3522.htm
- DOI: https://dx.doi.org/10.3748/wjg.v10.i23.3522


