Copyright
©The Author(s) 2004.
World J Gastroenterol. Dec 1, 2004; 10(23): 3514-3517
Published online Dec 1, 2004. doi: 10.3748/wjg.v10.i23.3514
Published online Dec 1, 2004. doi: 10.3748/wjg.v10.i23.3514
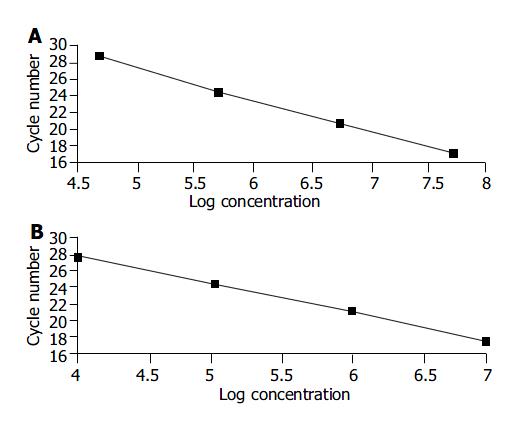
Figure 1 Standard curve of GAPDH and hTERT.
A: Standard curve of GAPDH: slope = -3.86, intercept = 46.60, r = -1.00. B: Standard curve of hTERT: slope = -3.42, intercept = 37.31, r = -1.00.
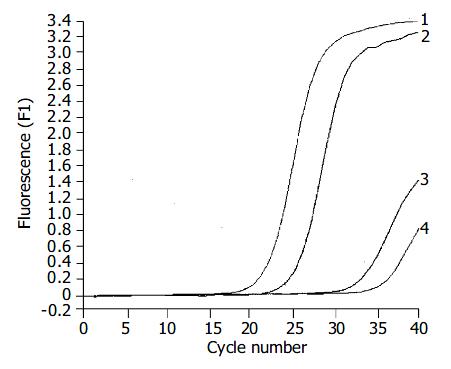
Figure 2 hTERT mRNA expression in samples of gastric can-cer and corresponding non-cancerous tissues.
Lanes 1, 2: Gas-tric cancer; Lanes 3, 4: Corresponding non-cancerous tissues.
- Citation: Hu LH, Chen FH, Li YR, Wang L. Real-time determination of human telomerase reverse transcriptase mRNA in gastric cancer. World J Gastroenterol 2004; 10(23): 3514-3517
- URL: https://www.wjgnet.com/1007-9327/full/v10/i23/3514.htm
- DOI: https://dx.doi.org/10.3748/wjg.v10.i23.3514


