Copyright
©The Author(s) 2004.
World J Gastroenterol. Dec 1, 2004; 10(23): 3490-3494
Published online Dec 1, 2004. doi: 10.3748/wjg.v10.i23.3490
Published online Dec 1, 2004. doi: 10.3748/wjg.v10.i23.3490
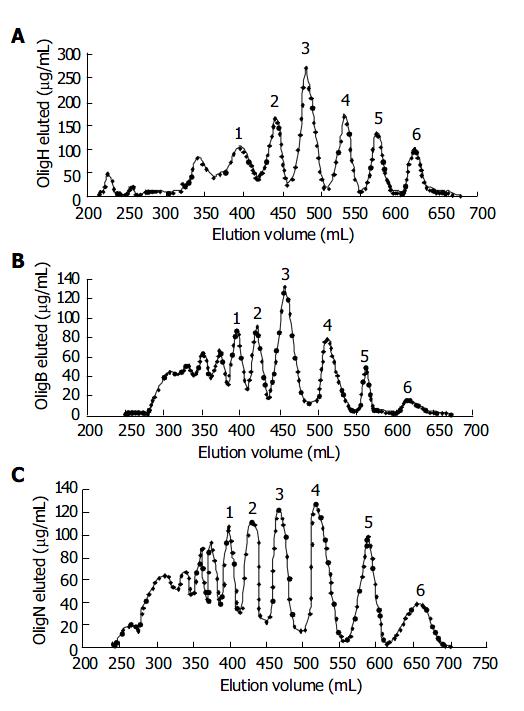
Figure 1 Size separation of heparin oligosaccharides.
A: hep-arin degraded with hydrogen peroxide; B: heparin degraded with β -eliminative cleavage; C: heparin degraded with nitrous acids. The reaction products were separated on a Superdex 30 size exclusion column (26 mm×1 200 mm) at a flow rate of 0.5 mL/min in 0.25 mol/L ammonium bicarbonate. Elution profiles were monitored by carbazole assay.
Figure 2 Content of IL-4 (A) and IL-5 (B) in PBTL culture solution of different groups.
I, II and III represent blank control group, PHA control group and heparin group respectively. Olig1 to Olig 6 represent corresponding oligasaccharide samples described in Table 1 (from 1 to 6), respectively. aP < 0.05, bP < 0.01 vs PHA group; cP < 0.05 vs Olig H4 group. (n = 10 for each group).
Figure 3 Relationship between Mr of Oligs and their activity on inhibiting IL-4 (A) and IL-5 (B) secretion.
aP < 0.05 vs Olig H4 group.
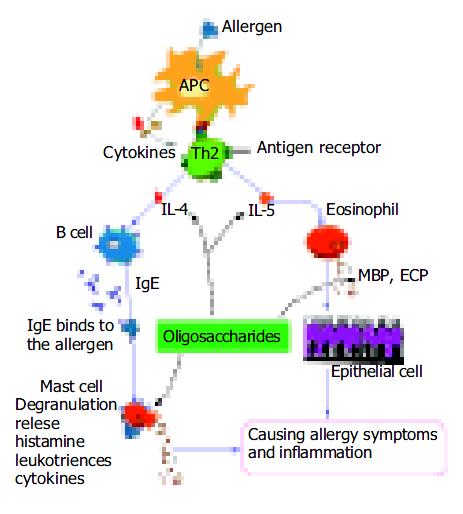
Figure 4 Interactions among inflammatory cells in pathogen-esis of allergic eosinophilic gastroenteritis.
Broken arrows denote the inhibitory effect of heparin-derived oligosaccha-rides on the various targets shown. MBP: major basic protein; and ECP: eosinophil cationic protein.
- Citation: Ji SL, Cui HF, Shi F, Chi YQ, Cao JC, Geng MY, Guan HS. Inhibitory effect of heparin-derived oligosaccharides on secretion of interleukin-4 and interleukin-5 from human peripheral blood T lymphocytes. World J Gastroenterol 2004; 10(23): 3490-3494
- URL: https://www.wjgnet.com/1007-9327/full/v10/i23/3490.htm
- DOI: https://dx.doi.org/10.3748/wjg.v10.i23.3490


