Copyright
©The Author(s) 2004.
World J Gastroenterol. Dec 1, 2004; 10(23): 3470-3474
Published online Dec 1, 2004. doi: 10.3748/wjg.v10.i23.3470
Published online Dec 1, 2004. doi: 10.3748/wjg.v10.i23.3470
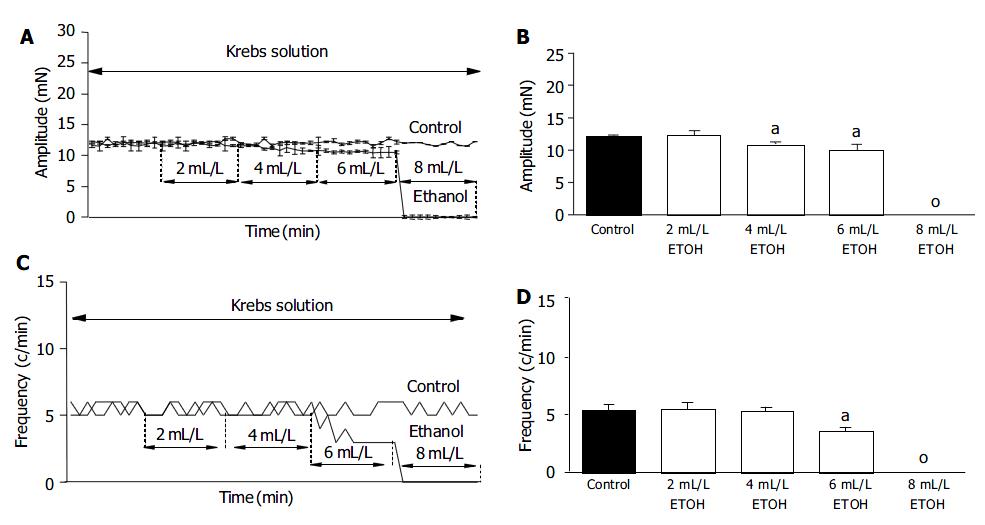
Figure 1 Basal SO motility inhibited by ETOH.
Sphincter of Oddi (SO) was exposed to increasing doses of ethanol (ETOH; 2 mL/L, 4 mL/L, 6 mL/L and 8 mL/L). Each concentration of ETOH was administered for 10 min. A: Effect of ETOH on the baseline amplitude. Representative experiments of the control and the ETOH-treated groups are shown. B: Summary of the effect of ETOH on the baseline amplitude. Mean ± SE, n = 5, aP < 0.05 vs the control; o: no contractile activity. C: Effect of ETOH on the contractile frequency. Representative experiments of the control and the ETOH-treated groups are shown. D: Summary of the effect of ETOH on the contractile frequency. Mean ± SE, n = 5, aP < 0.05 vs the control; o: no contractile activity.
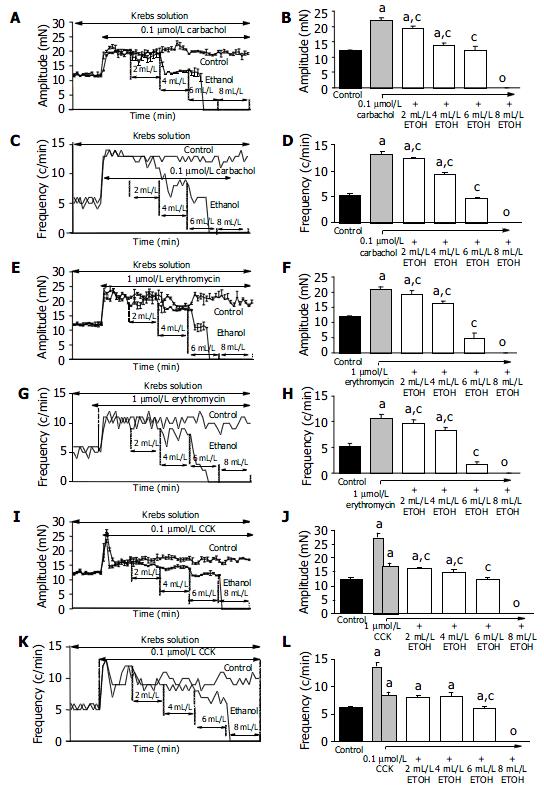
Figure 2 Effect of ETOH on carbachol, erythromycin, CCK stimulated SO motility.
All of the SOs were stimulated by 0.1 μmol/L carbachol for 40 min. Different concentrations of ETOH were administered as described in Figure 1. A: Effect of ETOH on the carbachol-stimulated baseline amplitude. Representative experiments of the control (carbachol-treated) and the ETOH-carbachol-treated groups are shown. B: Summary of the effect of ETOH on the carbachol-stimulated baseline amplitude. Mean ± SE, n = 5, aP < 0.05 vs control, cP < 0.05 vs the carbachol-stimulated group, o: no contractile activity. C: Effect of ETOH on the contractile frequency. Representative experiments of the (carbachol-treated) and the ETOH-carbachol-treated groups are shown. D: Summary of the effect of ETOH on the carbachol-stimulated contractile frequency. Mean ± SE, n = 5, aP < 0.05 vs control, cP < 0.05 vs the carbachol-stimulated group, o: no contractile activity. E: Effect of ETOH on the erythromycin-stimulated baseline amplitude. Representative experiments of the control (erythromycin-treated) and the ETOH-erythromycin-treated groups are shown. F: Summary of the effect of ETOH on the erythromycin-stimulated baseline amplitude. Mean ± SE, n = 5, aP < 0.05 vs the control, cP < 0.05 vs the erythro-mycin-stimulated group, o: no contractile activity. G: Effect of ETOH on the contractile frequency. Representative experiments of the control (erythromycin-treated) and the ETOH-erythromycin-treated groups are shown. H: Summary of the effect of ETOH on the erythromycin-stimulated contractile frequency. Mean ± SE, n = 5, aP < 0.05 vs the control, cP < 0.05 vs the erythromycin-stimulated group, o: no contractile activity. I: Effect of ETOH on the carbachol-stimulated baseline amplitude. Representative experiments of the control (CCK-treated) and the ETOH-CCK-treated groups are shown. J: Summary of the effect of ETOH on the CCK-stimulated baseline amplitude. Mean ± SE, n = 5, aP < 0.05 vs the control; o: no contractile activity. In the 0.1 μmol/L CCK-treated group, the first column represents the peak amplitude of contractile frequencies. The second column represents the constant amplitudes after the peak. aP < 0.05 vs the constant amplitude of the CCK-treated group. K: Effect of ETOH on the contractile frequency. Representative experiments of the (CCK-treated) and ETOH-CCK-treated groups are shown. L: Summary of the effect of ETOH on the CCK-stimulated contractile frequency. Mean ± SE, n = 5, aP < 0.05 vs the control; o: no contractile activity. In the 0.1 μmol/L CCK-treated group, the first column represents the peak of frequencies. The second column represents the constant frequencies after the peak. cP < 0.05 vs the constant frequency of the CCK-treated group.
-
Citation: Sári R, Pálvölgyi A, Jr ZR, Takács T, Lonovics J, Czakó L, Szilvássy Z, Hegyi P. Ethanol inhibits the motility of rabbit sphincter of Oddi
in vitro . World J Gastroenterol 2004; 10(23): 3470-3474 - URL: https://www.wjgnet.com/1007-9327/full/v10/i23/3470.htm
- DOI: https://dx.doi.org/10.3748/wjg.v10.i23.3470


