Copyright
©The Author(s) 2004.
World J Gastroenterol. Dec 1, 2004; 10(23): 3459-3463
Published online Dec 1, 2004. doi: 10.3748/wjg.v10.i23.3459
Published online Dec 1, 2004. doi: 10.3748/wjg.v10.i23.3459
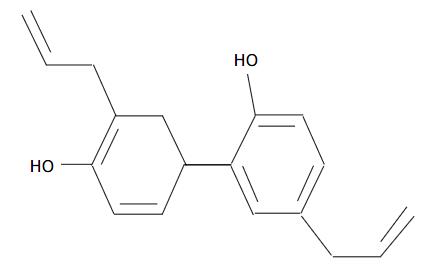
Figure 1 Chemical structure of honokiol (C18H18O2, MW = 266.
33).
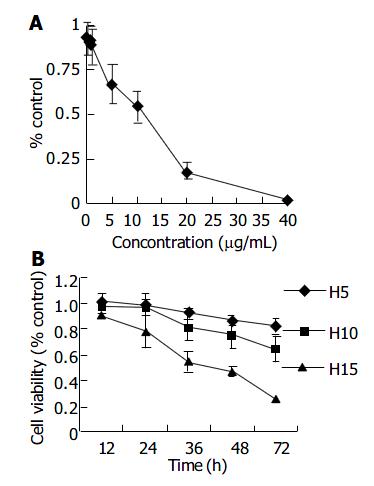
Figure 2 Concentration- and time-dependent inhibition of RKO cells exposed to honokiol shown by MTT assay.
(A) RKO cells were plated in quadruplicate in 96-well plates and treated with increasing concentrations of honokiol for 68 h. (B) RKO cells treated with 5, 10 and 15 μg/mL of honokiol were tested at different time points.
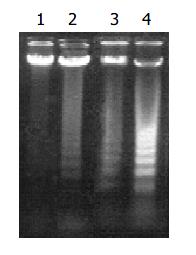
Figure 3 Differences in vehicle or honokiol induced apoptotic DNA laddering of RKO cells.
lane 1: control; lane 2: 5 μg/mL; lane 3: 10 μg/mL; lane 4: 15 μg/mL.
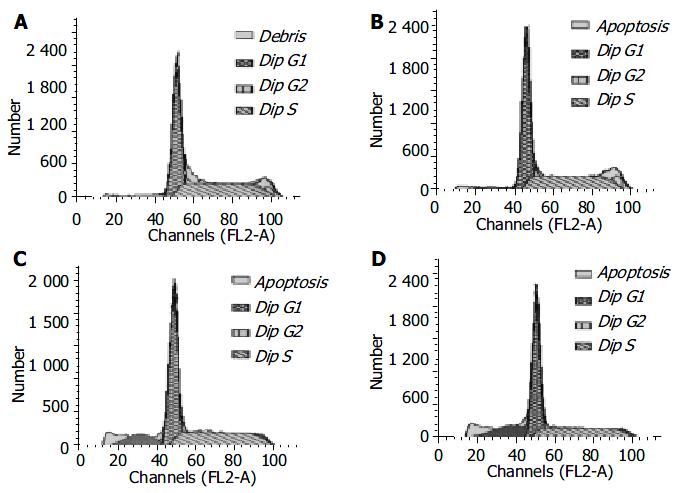
Figure 4 Apoptosis of RKO cells detected by FCM.
(A) control; (B) 5 μg/mL; (C) 10 μg/mL; (D) 15 μg/mL.
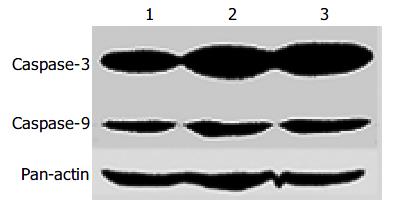
Figure 5 Western blot analysis for the expression of Caspase-3 and -9 in human colorectal carcinoma cell line RKO cells.
Lane 1: vehicle; lane 2: 5 μg/mL; lane 3: 10 μg/mL.
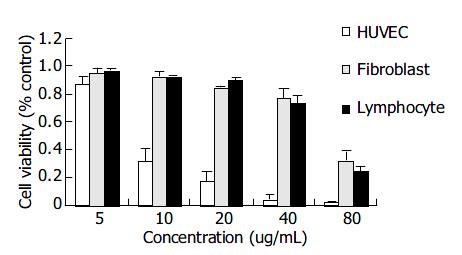
Figure 6 Cytocidal effect of honokiol on the growth of primary cultured human umbilical vein endothelial cells, primary hu-man fibroblast cells and human lymphocytes.
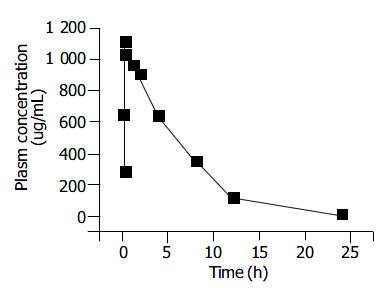
Figure 7 Honokiol concentration in plasma of BALB/c mice.
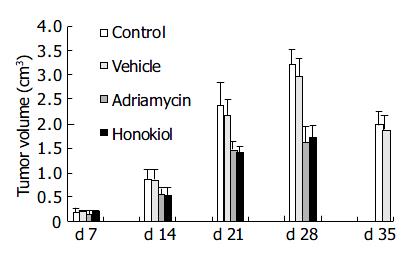
Figure 8 Effect of honokiol on the growth of xenografted RKO in Balb/c nude mice.
The Y-axis represents tumor volume, X-axis represents time (day) after RKO cell inoculation.
- Citation: Chen F, Wang T, Wu YF, Gu Y, Xu XL, Zheng S, Hu X. Honokiol: A potent chemotherapy candidate for human colorectal carcinoma. World J Gastroenterol 2004; 10(23): 3459-3463
- URL: https://www.wjgnet.com/1007-9327/full/v10/i23/3459.htm
- DOI: https://dx.doi.org/10.3748/wjg.v10.i23.3459


