Copyright
©The Author(s) 2004.
World J Gastroenterol. Dec 1, 2004; 10(23): 3441-3454
Published online Dec 1, 2004. doi: 10.3748/wjg.v10.i23.3441
Published online Dec 1, 2004. doi: 10.3748/wjg.v10.i23.3441
Figure 1 Methylation profiles of the promoter CpG islands of 31 genes in CRC.
Both electrophoretic patterns of the representa-tive PCR products of each of 31 targets (indicated respectively, at the top of figures) and the sequencing verification of the one representative PCR product are presented. To indicate the methylation status, the sequenced data are aligned with the wild-type sequence. 1Size markers, the bands of 250 bp and 100 bp are shown. U, the unmethylated; M, hypermethylated. Panels: 1, APC, 2, BRCA1, 3, CDH1, 4, CDH13, 5, CDX1, 6, COX2, 7,CXX1, 8, cyclin A1, 9, DPAK1, 10, DNMT1, 11, hMLH1, 12, MAGEA1, 13, MGMT, 14, MINT1, 15, MINT31, 16, MYOD1, 17, N33, 18, p14ARF, 19, p15INK4b, 20, p16INK4a 21, p21WAF1, 22, p27KIP1, 23, p73, 24, PTEN, 25, RAR-b, 26, RASSF1A, 27, RASSF1C, 28, SFRP1, 29, TIMP3, 30, VHL, and 31, WT1.
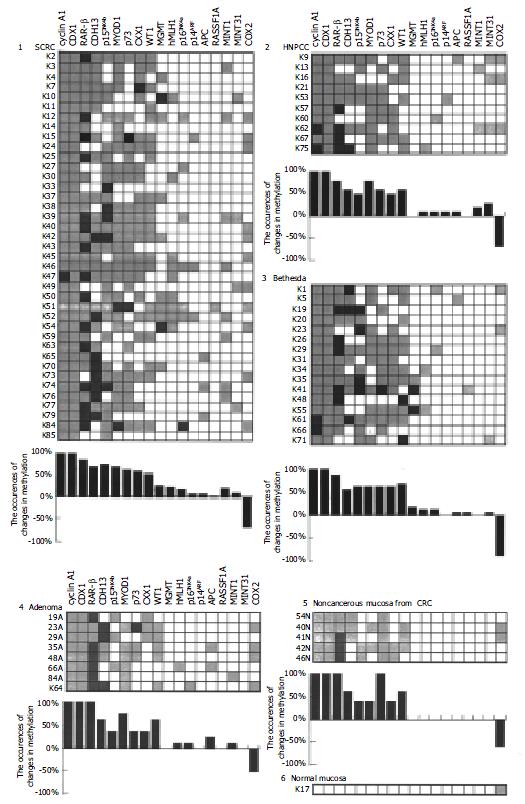
Figure 2 Changes in methylation pattern of genes in CRC and other relevant tissues.
The frequency (%) of the hypermethylated targets among the total cases was calculated, and the frequency of the changes in the methylation pattern is presented in the plot as well as in the attached table. Panels: 1, SCRC, 2, HNPCC, 3, Bethesda, 4, Adenoma, 5, Non-cancerous mucosa from CRC patients and 6, the normal mucosa from a non-cancerous patient.
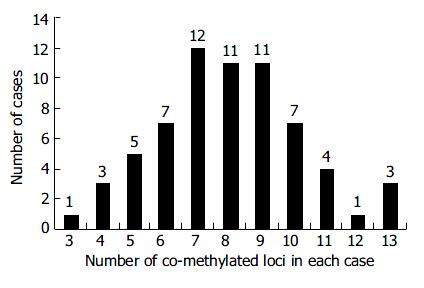
Figure 3 Concordant behavior of the multiple methylated loci in CRC.
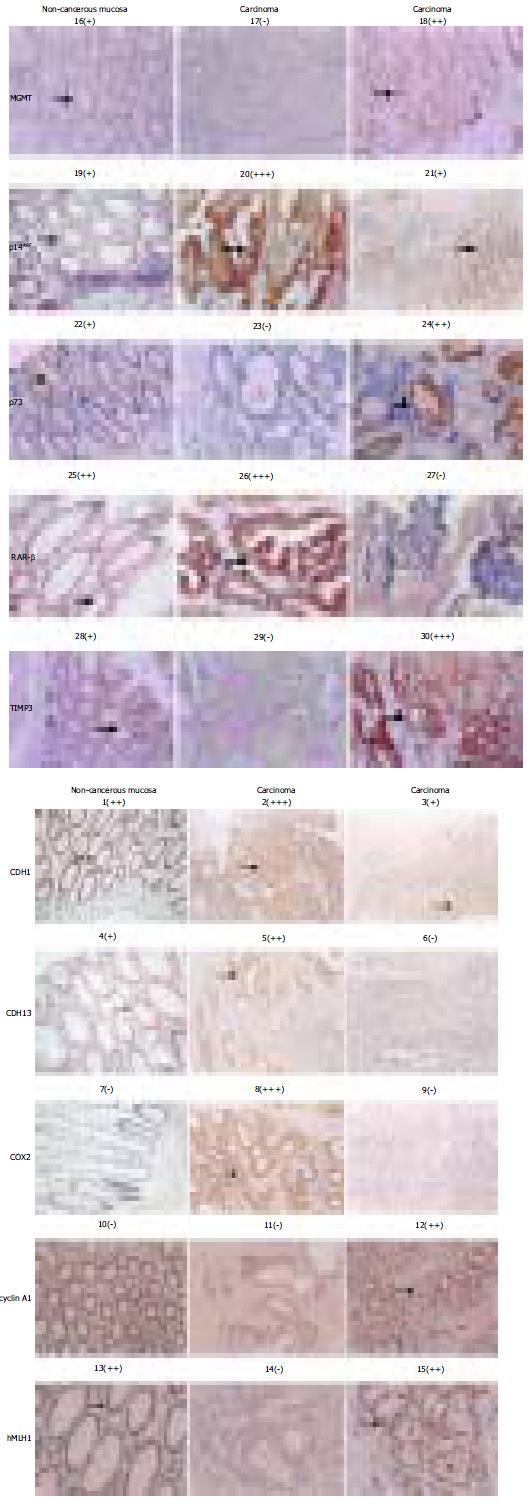
Figure 4 Immunochemical assessment of the expression level of each of 10 target genes.
Both the protein targets (left site to) and sample identities (top down) of the immuno-chemical stained picture are indicated. The signs: -, +, + +, and + + + in bracket are used to provide the quantitative reference in pictures below. The areas pointed by the arrows are the regions showing the immunostaining data quantified.
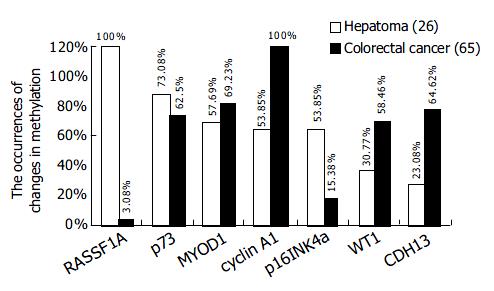
Figure 5 Tumor specific methylation pattern: CRC verse HCC.
- Citation: Xu XL, Yu J, Zhang HY, Sun MH, Gu J, Du X, Shi DR, Wang P, Yang ZH, Zhu JD. Methylation profile of the promoter CpG islands of 31 genes that may contribute to colorectal carcinogenesis. World J Gastroenterol 2004; 10(23): 3441-3454
- URL: https://www.wjgnet.com/1007-9327/full/v10/i23/3441.htm
- DOI: https://dx.doi.org/10.3748/wjg.v10.i23.3441


