Copyright
©The Author(s) 2004.
World J Gastroenterol. Dec 1, 2004; 10(23): 3394-3398
Published online Dec 1, 2004. doi: 10.3748/wjg.v10.i23.3394
Published online Dec 1, 2004. doi: 10.3748/wjg.v10.i23.3394
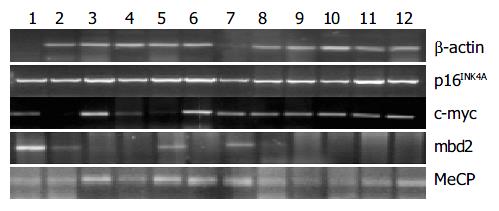
Figure 1 mRNA expression of p16INK4A, c-myc, mbd2 and MeCP2 in cancerous (lanes 1, 4, 7 and 10), para-cancerous (lanes 2, 5, 8 and 11) and non-cancerous (lanes 3, 6, 9 and 12) tissues from patients with gastric cancer by using RT-PCR.
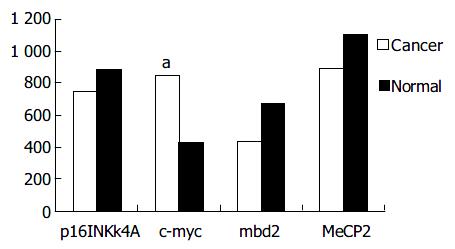
Figure 2 Density of bands from RT-PCR in each lane normalized to the total RNA as determined by the density of bands in RT-PCR for β -actin.
Assuming β -actin was 4 562.39 units (pixels of brightness), the calculation [4 562.39/(density of actin)] × (density of each gene) equals each gene normalized to β -actin. Data shown are representative of three separate experiments. aP < 0.05.
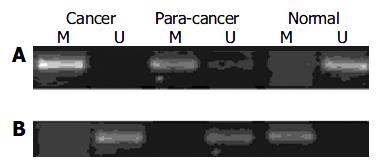
Figure 3 Hypermethylation of p16INK4A promoter (A) and hypomethylation of proto-oncogene c-myc promoter (B) in gastric cancer tissue indicated by MSP.
U: unmethylation-spe-cific PCR; M: methylation-specific PCR.
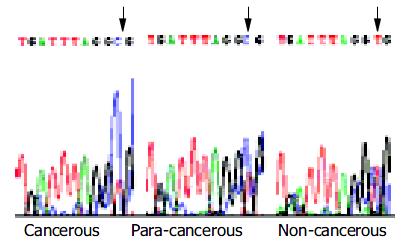
Figure 4 Methylation analysis of hMSH2 gene promoter by bisulfite sequencing.
The arrows indicate the changes of CG to TG in promoters of non-cancerous and para-cancerous tissue, but CG remained in cancerous tissues.
- Citation: Fang JY, Cheng ZH, Chen YX, Lu R, Yang L, Zhu HY, Lu LG. Expression of Dnmt1, demethylase, MeCP2 and methylation of tumor-related genes in human gastric cancer. World J Gastroenterol 2004; 10(23): 3394-3398
- URL: https://www.wjgnet.com/1007-9327/full/v10/i23/3394.htm
- DOI: https://dx.doi.org/10.3748/wjg.v10.i23.3394


