Copyright
©The Author(s) 2004.
World J Gastroenterol. Aug 1, 2004; 10(15): 2179-2183
Published online Aug 1, 2004. doi: 10.3748/wjg.v10.i15.2179
Published online Aug 1, 2004. doi: 10.3748/wjg.v10.i15.2179
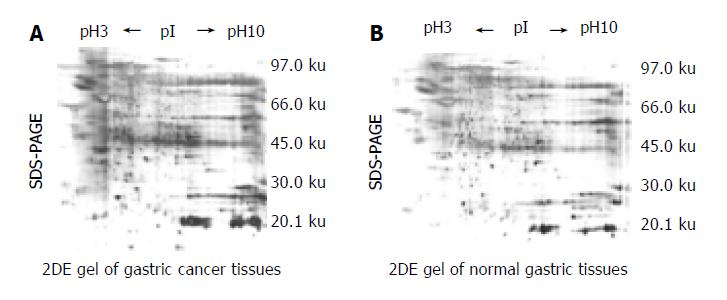
Figure 1 2DE maps of human gastric tissue from No.
5 patient. A: was from gastric cancer. B: from normal gastric sample of the same patient. Proteins were separated on pH 3 -10 linear IPG strip in the first dimension and 125 g/L SDS-PAGE in the second dimension, gels were silver stained. All labeled spots were tumor-specific.
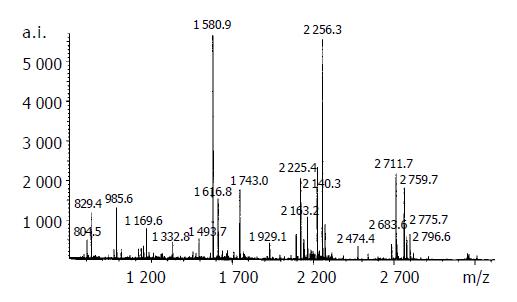
Figure 2 MALDI-TOF MS of tryptic digests of protein spot No.
18 resolved on 2DE gel, REFLEX III (BLuker). The data were collected on positive ion and reflector mode. Experimentally determined mass values are labeled on peptides. Spot 10 matched peptide 11; amino acid coverage, 60%; the spot was identified as carbonic anhydrase I.
- Citation: Wang KJ, Wang RT, Zhang JZ. Identification of tumor markers using two-dimensional electrophoresis in gastric carcinoma. World J Gastroenterol 2004; 10(15): 2179-2183
- URL: https://www.wjgnet.com/1007-9327/full/v10/i15/2179.htm
- DOI: https://dx.doi.org/10.3748/wjg.v10.i15.2179


