Copyright
©The Author(s) 2004.
World J Gastroenterol. Aug 1, 2004; 10(15): 2174-2178
Published online Aug 1, 2004. doi: 10.3748/wjg.v10.i15.2174
Published online Aug 1, 2004. doi: 10.3748/wjg.v10.i15.2174
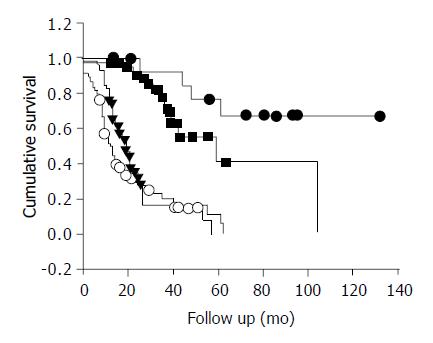
Figure 1 Survival rate of gastric adenocarcinoma patients ac-cording to stage using Kaplan-Meier analysis.
(●) Stage I; n = 15, (■) Stage II; n = 41, (▼) Stage III; n = 59, (○) Stage IV and X; n = 61.
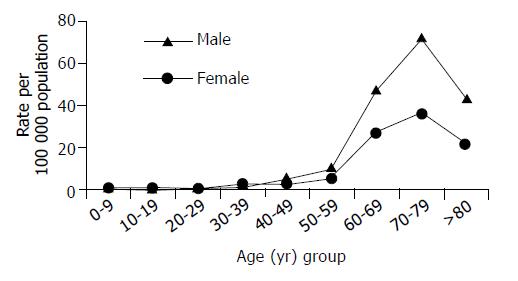
Figure 2 Age specific incidence rate per 100 000 population/year by gender.
- Citation: Bani-Hani KE, Yaghan RJ, Heis HA, Shatnawi NJ, Matalka II, Bani-Hani AM, Gharaibeh KA. Gastric malignancies in Northern Jordan with special emphasis on descriptive epidemiology. World J Gastroenterol 2004; 10(15): 2174-2178
- URL: https://www.wjgnet.com/1007-9327/full/v10/i15/2174.htm
- DOI: https://dx.doi.org/10.3748/wjg.v10.i15.2174


