Copyright
©The Author(s) 2004.
World J Gastroenterol. Jul 15, 2004; 10(14): 2072-2077
Published online Jul 15, 2004. doi: 10.3748/wjg.v10.i14.2072
Published online Jul 15, 2004. doi: 10.3748/wjg.v10.i14.2072
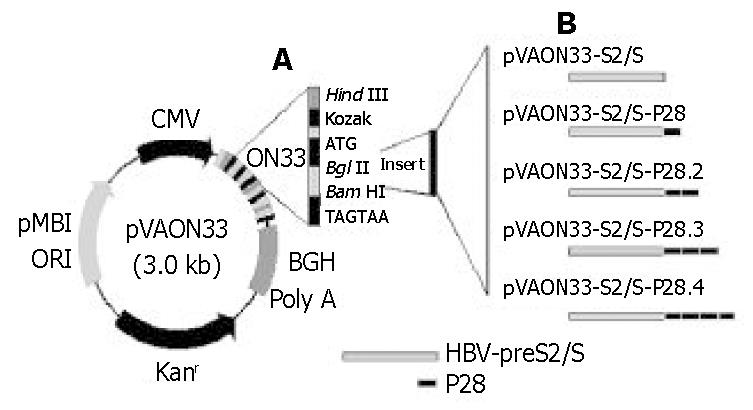
Figure 1 Schematic illustration representation of vector DNA vaccine constructs.
A: A synthetic oligonucleotide (ON33) was inserted into the pVAX1 vector by the Hind III and BamH I restriction endonuclease sites. Inserts were cloned into the vector using the BglII and BamH I sites. B: The scheme represents constructs expressing fusions of HBV-preS2/S to variable copies of C3d-P28.
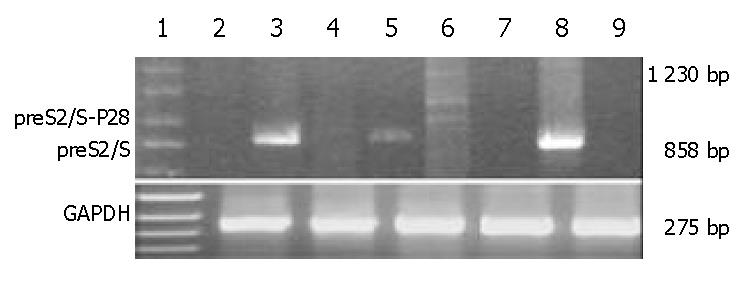
Figure 2 Semiquantitative RT-PCR for expression of the preS2/S-P28 fusion proteins.
Lane 1: DNA marker; Lanes 2,3 and 5: RT-PCR with preS2/Ss and preS2/Sa primers that am-plified an entire coding region (858 bp) of preS2/S, using RNA extracted from pVAON33, pVAON33-S2/S and pVAON33-S2/S-P28.4 transfected-cells, respectively; Lanes 4 and 6: RT-PCR with preS2/Ss and P28a primers that amplified a 1230 bp cDNA fragment of preS2/S-P28.4 fusion cDNA (the ladder showed the RT-PCR production due to 4 copies of P28), using RNA extracted from pVAON33-S2/S and pVAON33-S2/S-P28.4 transfected-cells, respectively; Lanes 7 and 9: RNA extracted from pVAON33-S2/S and pVAON33-S2/S-P28.4 transfected-cells was founded to exclude the potential contamination of potential plasmid DNA by PCR with preS2/Ss and preS2/Sa primers, respectively; and Lane 8: pVAON33-S2/S plasmid DNA was taken as positive control.
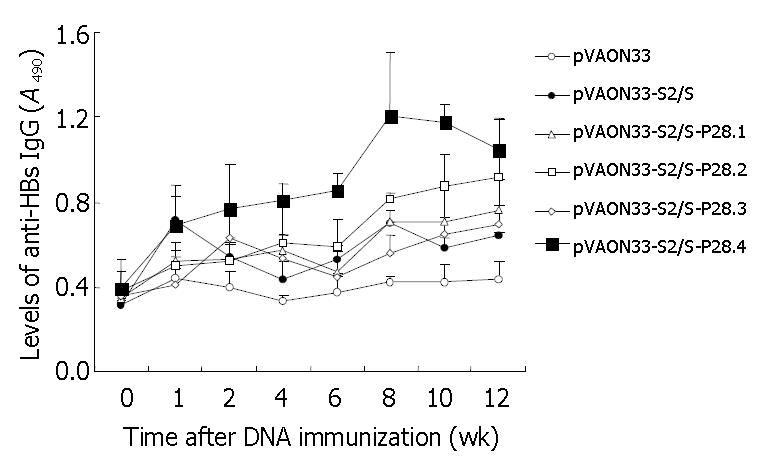
Figure 3 Determination of anti-HBs IgG of sera from mice primed by the plasmid vectors containing different copies of C3d-P28.
BALB/c mice (6 animals per group) were primed im at week 0 with 100 μg of mock DNA (○), pVAON33-S2/S plasmid (●), pVAON33-S2/S-P28 plasmid (△), pVAON33-S2/S-P28.2 plasmid (□), pVAON33-S2/S-P28.3 plasmid (◇) and pVAON33-S2/S-P28.4 plasmid (■), separately. Sera collected at the indicated weeks from each group were diluted 1:10 for determination of specific IgG levels by ELISA. Data were represented as the average for each group of mice. Error bars were represented as 95%CI of the geometric mean for each group of sera.
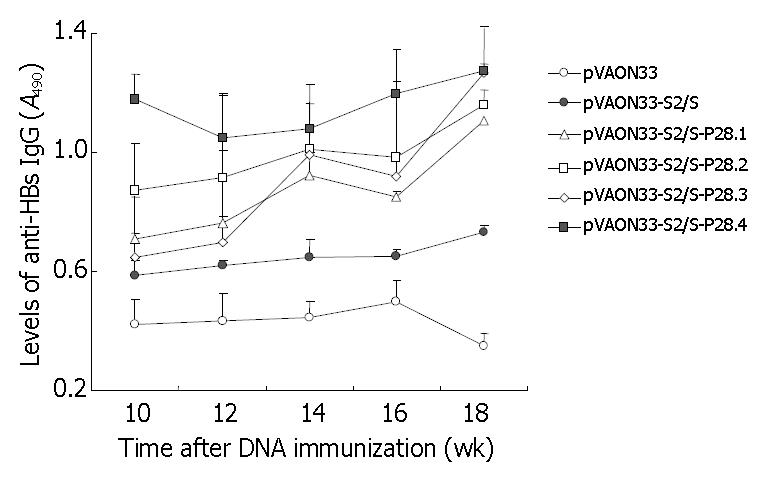
Figure 4 Determination of anti-HBs IgG of sera from mice primed by the different plasmid DNAs and boosted with HBsAg protein.
Each group of mice (n = 6) was primed im at week 0 with 100 μg of mock DNA (○), pVAON33-S2/S plasmid (●), pVAON33-S2/S-P28 plasmid (△), pVAON33-S2/S-P28.2 plasmid (□), pVAON33-S2/S-P28.3 plasmid (◇) and pVAON33-S2/S-P28.4 plasmid (■), separately. And then boosted sc at week 12 with HBsAg (1 μg per mouse). Sera collected at the indicated times from each group were diluted 1:10 for determination of specific IgG levels by ELISA.
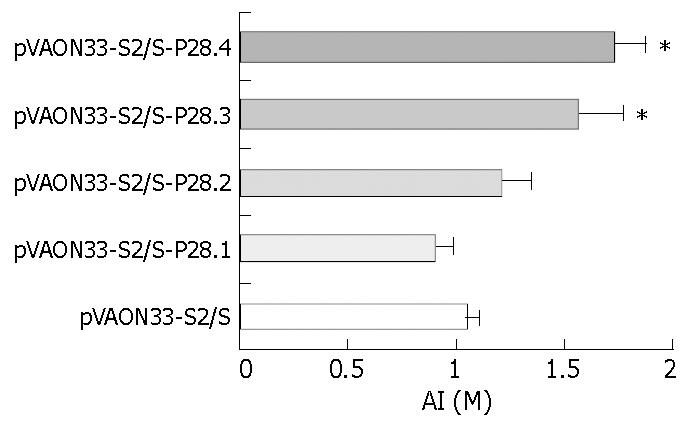
Figure 5 Determination of avidity of anti-HBs IgG of sera from immunized mice.
Mice (six mouse per group) were primed im at week 0 with 100 μg of different plasmid DNAs and then boosted sc at week 12 with HBsAg (1 μg per mouse). Sera were obtained at week 18. The pooled serum samples from each mouse group were diluted 1:10 for determination of avidity of the anti-HBs IgG by an HBsAg-specific NaSCN-displacement ELISA. Data were represented as the average of three inde-pendent experiments plus standard errors (mean ± SD).
- Citation: Wang LX, Xu W, Guan QD, Chu YW, Wang Y, Xiong SD. Contribution of C3d-P28 repeats to enhancement of immune responses against HBV-preS2/S induced by gene immunization. World J Gastroenterol 2004; 10(14): 2072-2077
- URL: https://www.wjgnet.com/1007-9327/full/v10/i14/2072.htm
- DOI: https://dx.doi.org/10.3748/wjg.v10.i14.2072


