Copyright
©The Author(s) 2004.
World J Gastroenterol. Jul 15, 2004; 10(14): 2063-2066
Published online Jul 15, 2004. doi: 10.3748/wjg.v10.i14.2063
Published online Jul 15, 2004. doi: 10.3748/wjg.v10.i14.2063
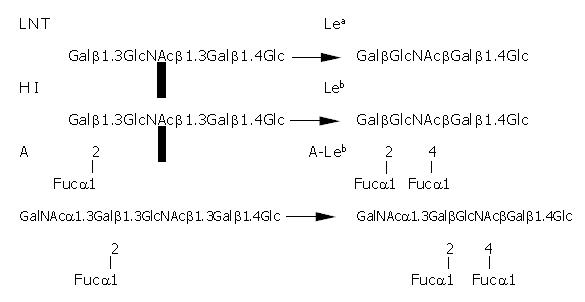
Figure 1 Formation of fucosylated blood group antigens.
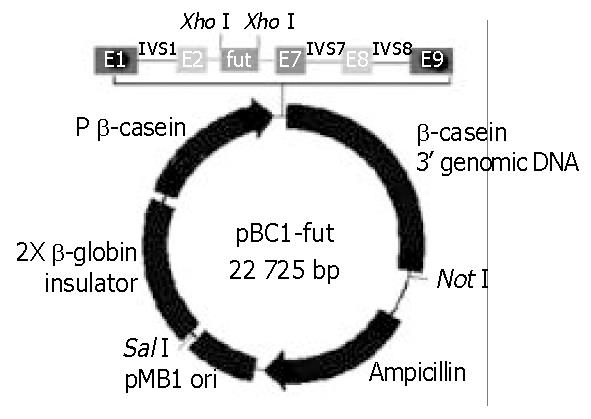
Figure 2 Map of expression vector: pBC1-fut.
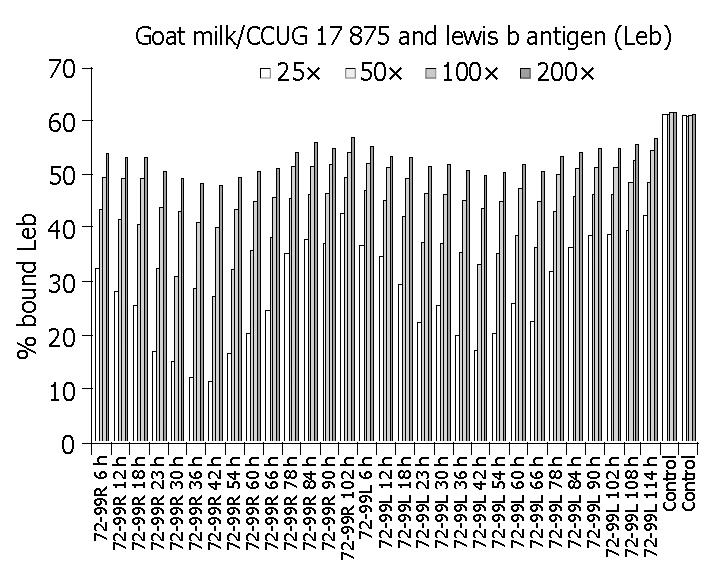
Figure 3 Blocking effect on H pylori binding to Lewis b antigen by goat milk.
Abscissa: Goat milk collected at different time points and control milk. Ordinate: Rate of H pylori binding to Lewis b antigen.
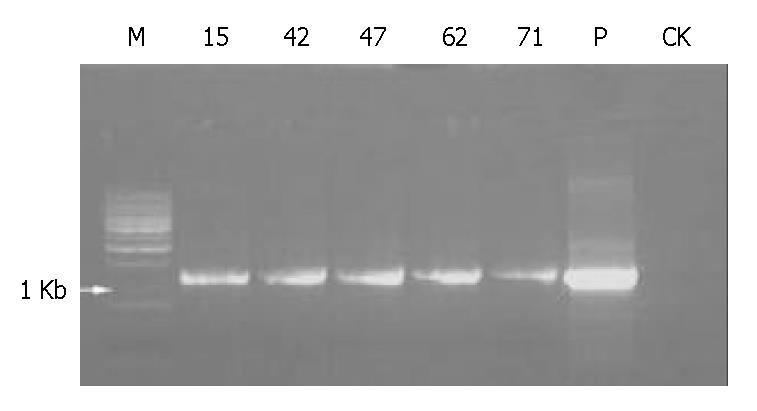
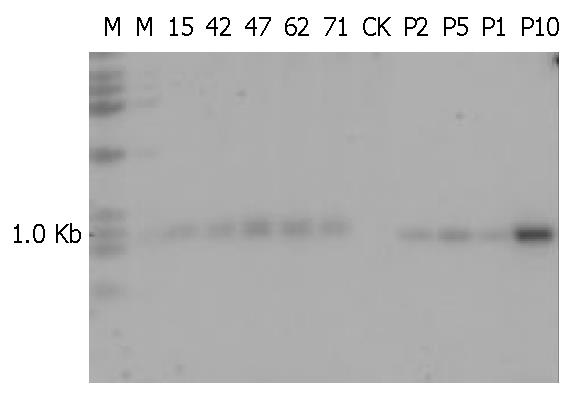
Figure 4 PCR results of transgenic mice.
M: DNA ladder; P: pBC1-fut plasmid; CK: Non-transgenic mouse. 15, 42, 47, 62 and 71: Serial numbers of gene positive mice.
Figure 5 Southern blotting of transgenic mice.
M: DNA ladder; CK: Non-transgenic mouse; P1, P2, P5 and P10: pBC1-fut plas-mid equivalent to 1, 2, 5 and 10 gene copies, respectively. 15, 42, 47, 62 and 71: Serial numbers of gene positive mice.
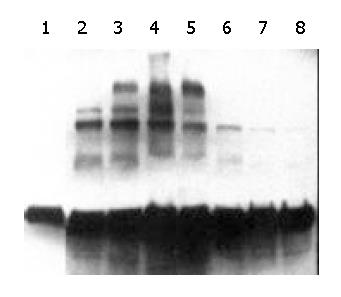
Figure 6 Western blotting of the transient expression milk of goat.
Lanes 1-8: Milk collected at different time points of 6, 18, 30, 42, 60, 78, 90, 100 h postinjection, respectively.
-
Citation: Xu HT, Zhao YF, Lian ZX, Fan BL, Zhao ZH, Yu SY, Dai YP, Wang LL, Niu HL, Li N, Hammarström L, Borén T, Sjöström R. Effects of fucosylated milk of goat and mouse on
Helicobacter pylori binding to Lewis b antigen. World J Gastroenterol 2004; 10(14): 2063-2066 - URL: https://www.wjgnet.com/1007-9327/full/v10/i14/2063.htm
- DOI: https://dx.doi.org/10.3748/wjg.v10.i14.2063


