Copyright
©The Author(s) 2004.
World J Gastroenterol. Jul 15, 2004; 10(14): 2024-2028
Published online Jul 15, 2004. doi: 10.3748/wjg.v10.i14.2024
Published online Jul 15, 2004. doi: 10.3748/wjg.v10.i14.2024
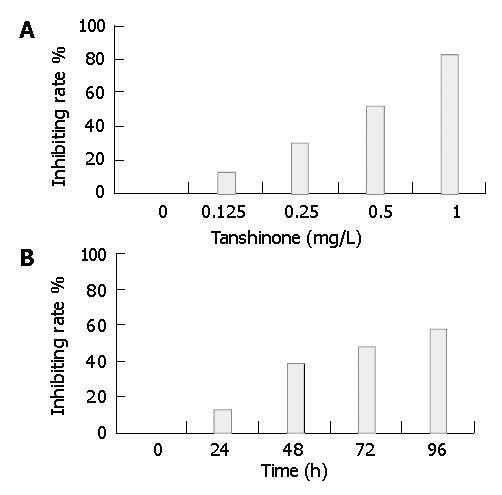
Figure 1 Growth-inhibitory effect of Tan II-A on SMMC-7721 cells detected by MTT.
A: In a dose-dependent manner detected by MTT; B: In a time-dependent manner detected by MTT.
Figure 2 Morphological characteristics of SMMC-7721 cells before and after Tan II-A treatment.
A: Roundish, large and serried SMMC-7721cells (in control group); B: Polygonal, small, detached or sparse, membranous frothed and wizened SMMC-7721cells (II A).
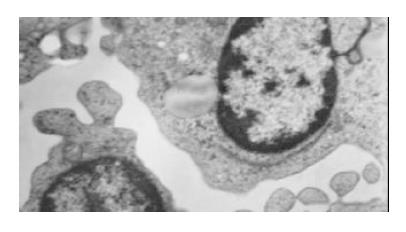
Figure 3 Ultrastructural changes of SMMC-7721 cells with 1.
0 mg/L Tan II-A treatment for 96 h under TEM (× 10000). The chromatin condensation, original margination were observed.
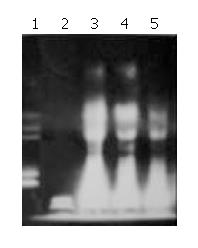
Figure 4 DNA agarose gel electrophoresis of SMMC-7721 cells with Tan II-A treatment for 96 h.
Lane 1: Marker, Lane 2: Control, Lane 3: 2.0 mg.L-1, Lane 4: 1.0 mg.L-1, Lane 5: 0.5 mg.L-1.
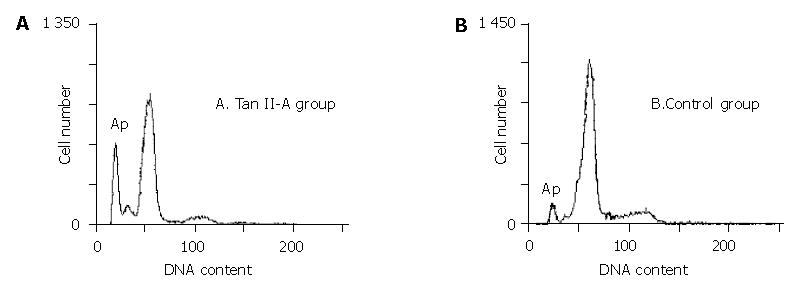
Figure 5 Flow cytometry analysis of apoptosis in SMMC-7721 cells treated with Tan II-A (A) and DMSO (B).
- Citation: Yuan SL, Wei YQ, Wang XJ, Xiao F, Li SF, Zhang J. Growth inhibition and apoptosis induction of tanshinone II-A on human hepatocellular carcinoma cells. World J Gastroenterol 2004; 10(14): 2024-2028
- URL: https://www.wjgnet.com/1007-9327/full/v10/i14/2024.htm
- DOI: https://dx.doi.org/10.3748/wjg.v10.i14.2024


