Copyright
©The Author(s) 2004.
World J Gastroenterol. Jun 15, 2004; 10(12): 1735-1739
Published online Jun 15, 2004. doi: 10.3748/wjg.v10.i12.1735
Published online Jun 15, 2004. doi: 10.3748/wjg.v10.i12.1735
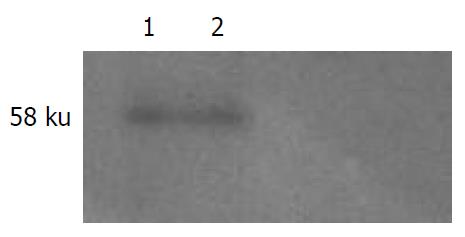
Figure 1 Western blotting of NS5A protein expression in HepG2 cells.
Lane 1: Expression plasmid pcDNA3.1 (-)-NS5A; Lane 2: Plasmid pcDNA3.1 (-)-vector.
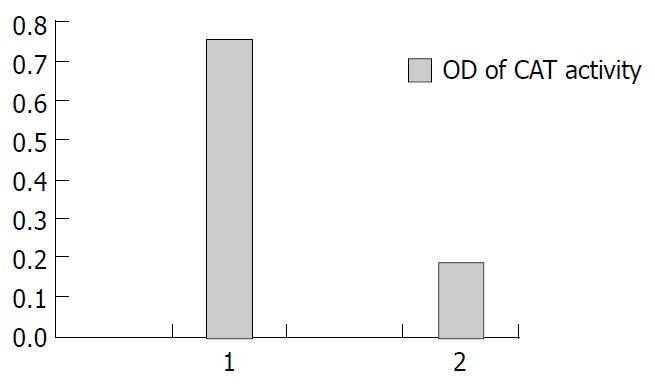
Figure 2 Transactivation on SV40 promoter by NS5A.
1: Plasmid pcDNA3.1 (-)-NS5A was cotransfected with pCAT3-promoter in HepG2 cells. 2: Plasmid pcDNA3.1 (-) was cotransfected with pCAT3-promoter in HepG2 cells.
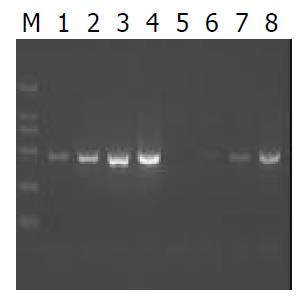
Figure 3 Reduction of G3PDH amount by PCR-selective subtraction.
PCR was performed on unsubtracted (Lanes 1-4) and subtracted (Lanes 5-8) secondary PCR products with the G3PDH 5’ and 3’ primers. Lanes 1, 5: 18 cycles; Lanes 2,6: 23 cycles; Lanes 3,7: 28 cycles.
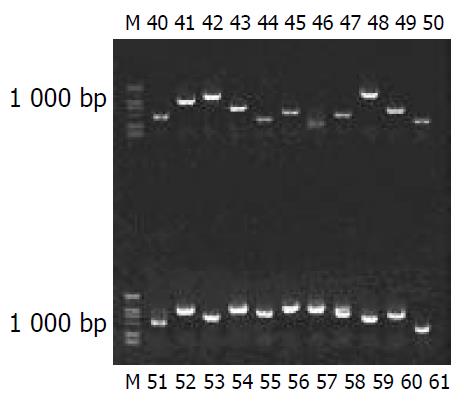
Figure 4 Map of colony PCR on 9 g/L agarose/EtBr gel.
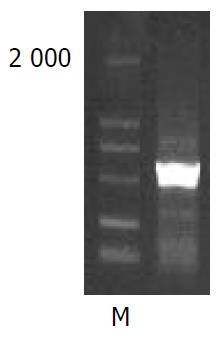
Figure 5 NS5A-TP2 fragment amplified by RT-PCR.
M: Marker.
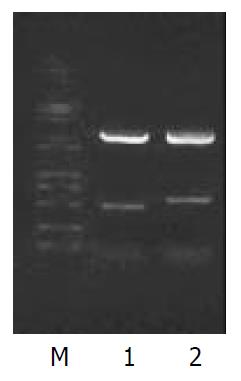
Figure 6 pEGM-T-NS5A-TP2 cut by EcoR I/Kpn I.
M: Marker; Lane 1: A 512-bp fragment; Lane 2: A 615-bp fragment.
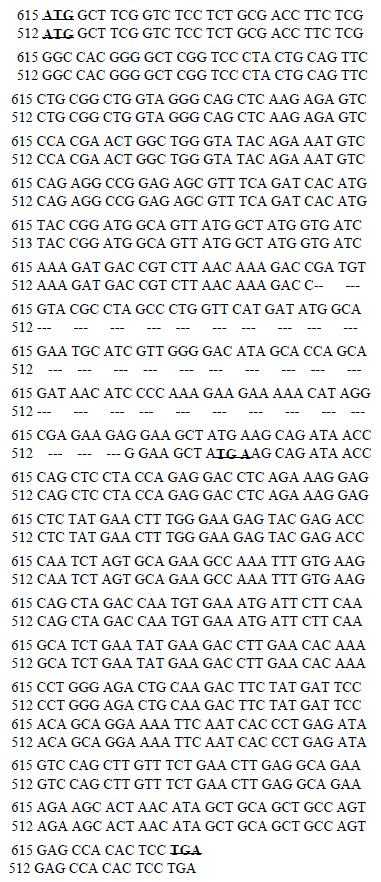
Figure 7 Comparison of exons and introns of NS5A-TP2 (615) and (512) gene.
Figure 8 ORF comparison of NS5A-TP2 (615) and (512).
-
Citation: Yang Q, Cheng J, Liu Y, Hong Y, Wang JJ, Zhang SL. Cloning and identification of
NS5ATP2 gene and its spliced variant transactivated by hepatitis C virus non-structural protein 5A. World J Gastroenterol 2004; 10(12): 1735-1739 - URL: https://www.wjgnet.com/1007-9327/full/v10/i12/1735.htm
- DOI: https://dx.doi.org/10.3748/wjg.v10.i12.1735


