Copyright
©The Author(s) 2020.
World J Meta-Anal. Apr 28, 2020; 8(2): 119-152
Published online Apr 28, 2020. doi: 10.13105/wjma.v8.i2.119
Published online Apr 28, 2020. doi: 10.13105/wjma.v8.i2.119
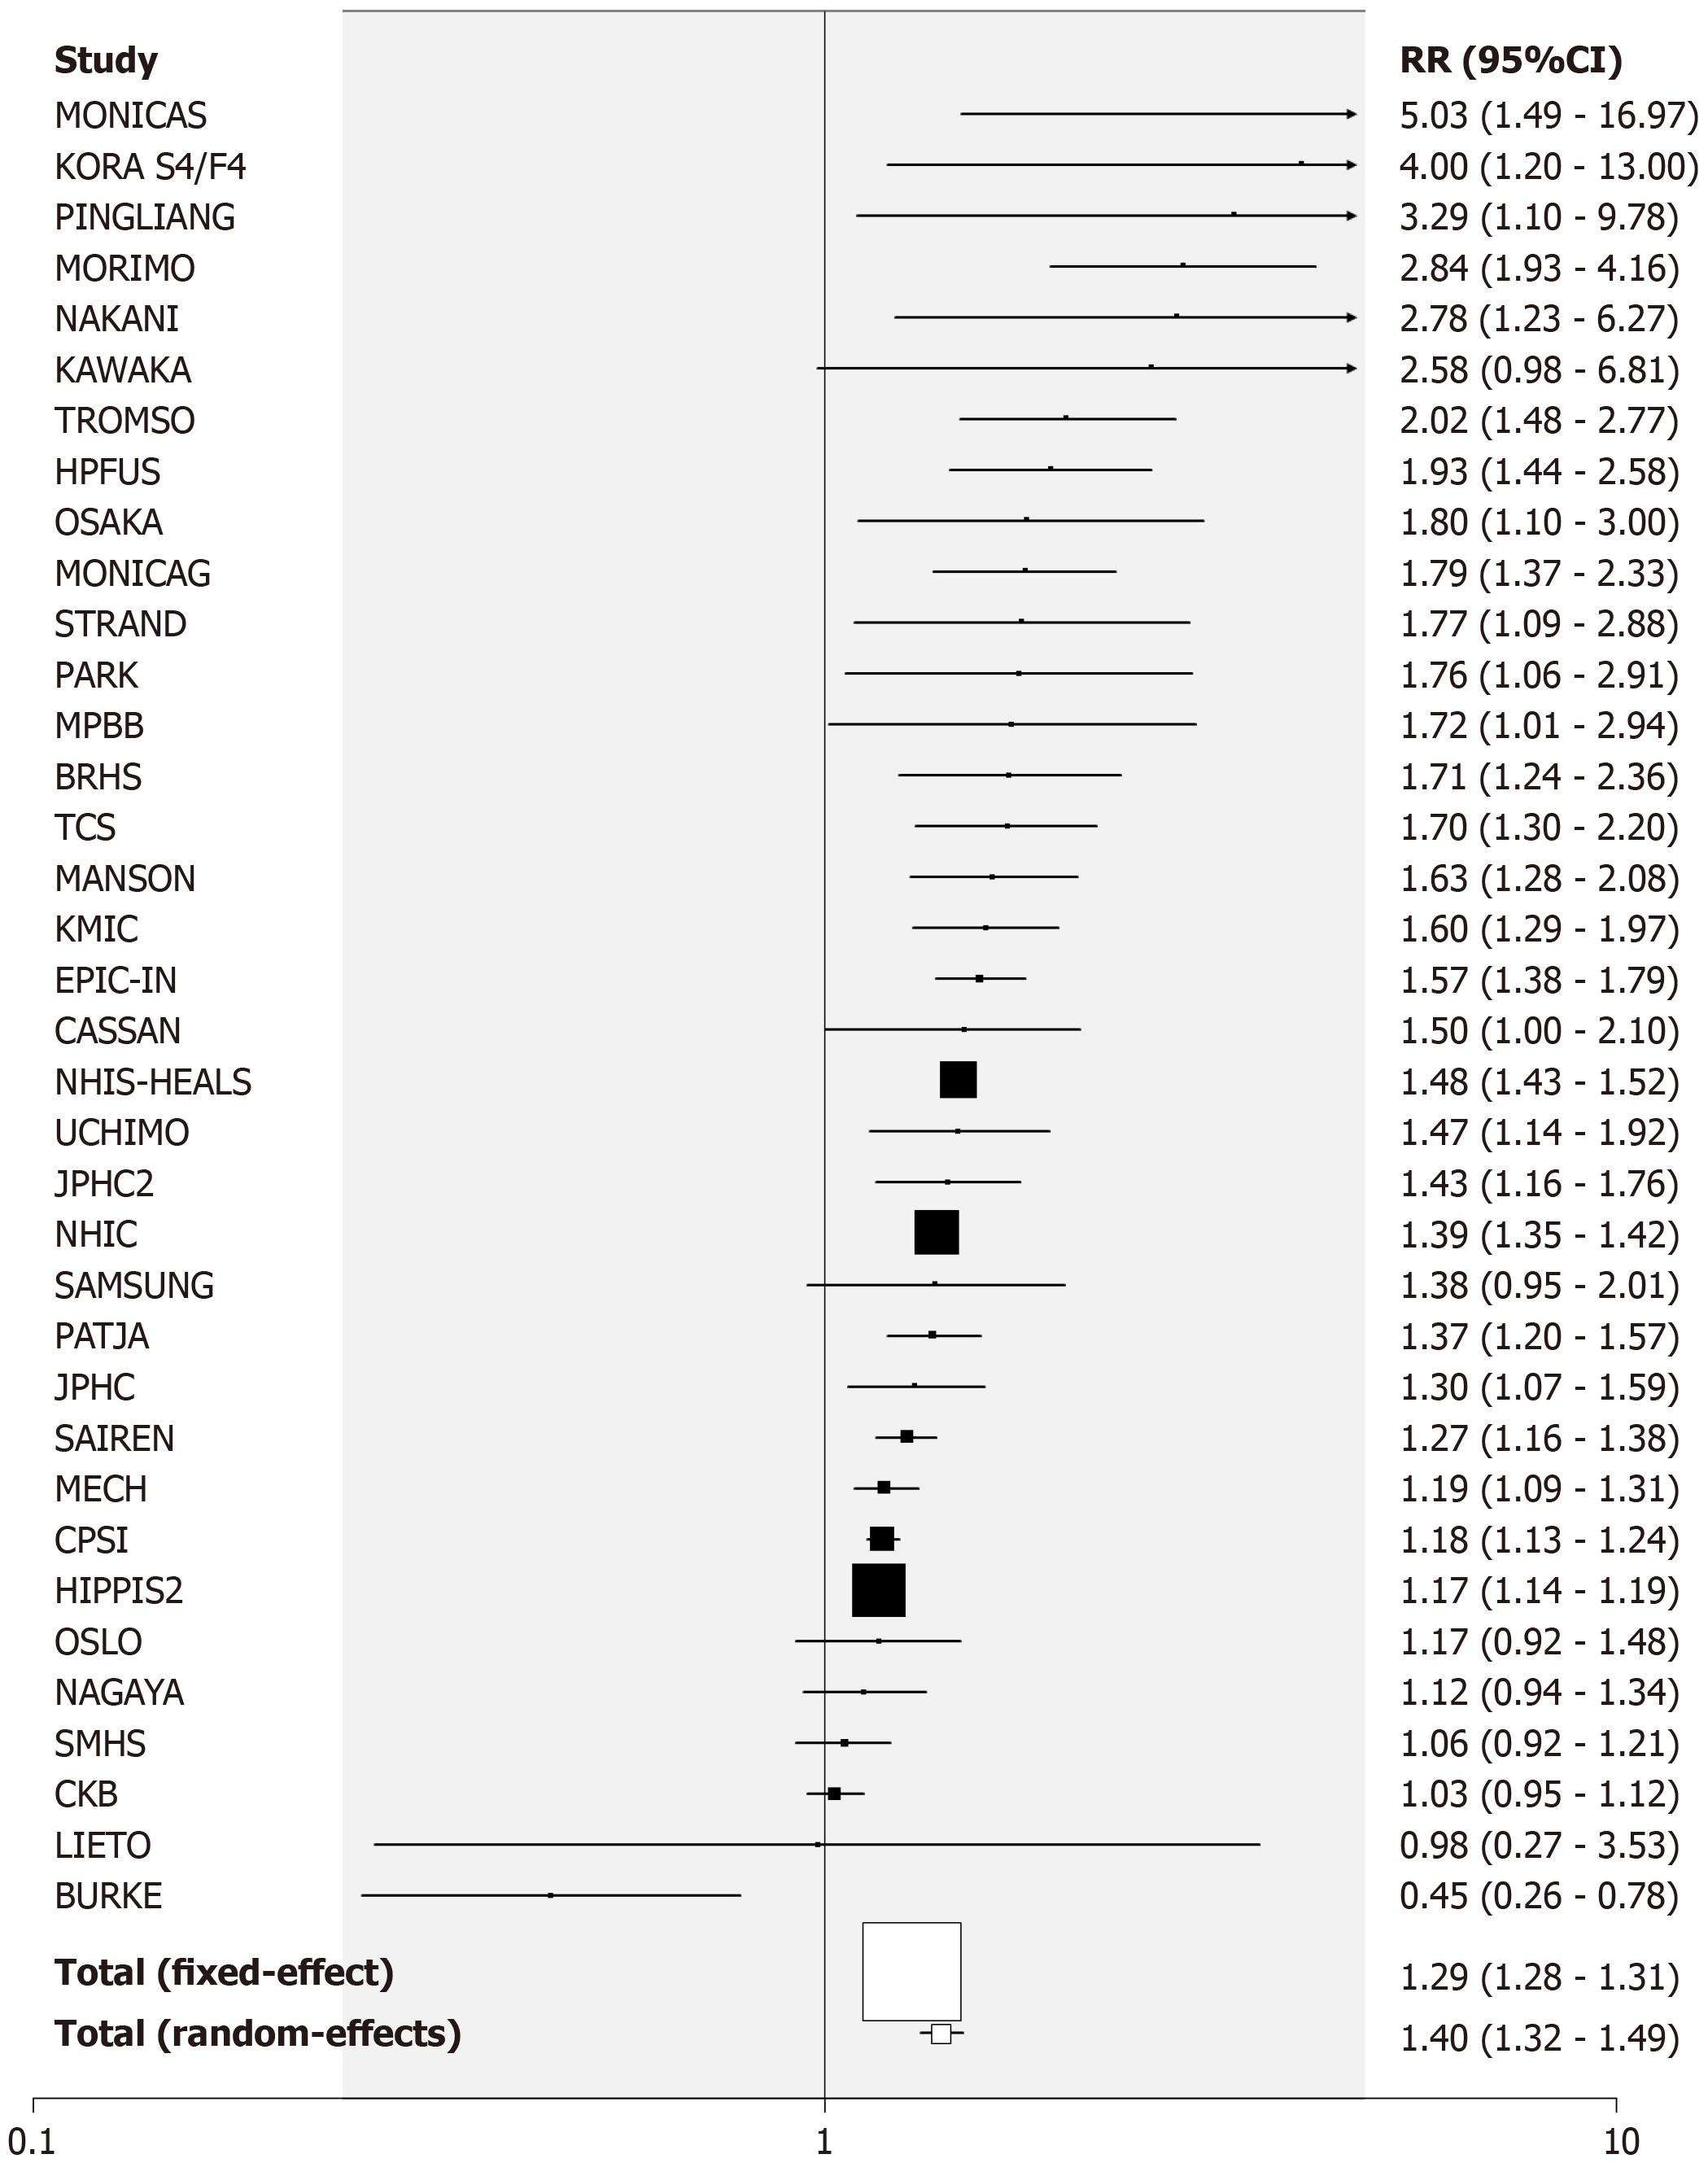
Figure 2 Forest plot for current vs never smoking, results for males.
For each selected relative risk (RR) the figure shows the study ref. (see Table 2) and the RR and 95% confidence interval, both numerically and plotted as a line on a log scale from 0.1 to 10. The RRs are plotted from highest to lowest, with the RR estimate shown in the centre of the line as a square, with area proportional to the weight of the estimate. Lines showing RRs with wide confidence intervals may be truncated, as indicated by an arrow head at the truncated end. Also shown are the overall fixed-effect and random-effects estimates. The vertical line is at RR = 1 with an increased risk indicated by a preponderance of squares to its right. RR: Relative risk; CI: Confidence interval.
- Citation: Lee PN, Coombs KJ. Systematic review with meta-analysis of the epidemiological evidence relating smoking to type 2 diabetes. World J Meta-Anal 2020; 8(2): 119-152
- URL: https://www.wjgnet.com/2308-3840/full/v8/i2/119.htm
- DOI: https://dx.doi.org/10.13105/wjma.v8.i2.119


