Copyright
©The Author(s) 2016.
World J Meta-Anal. Apr 26, 2016; 4(2): 10-43
Published online Apr 26, 2016. doi: 10.13105/wjma.v4.i2.10
Published online Apr 26, 2016. doi: 10.13105/wjma.v4.i2.10
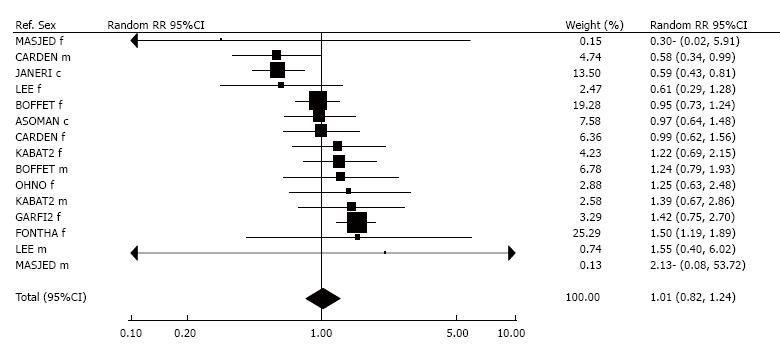
Figure 9 Forest plot for social environmental tobacco smoke exposure.
Estimates of the random-effects RR and its 95%CI are shown, sorted in increasing order of RR. These are shown numerically, and also graphically on a logarithmic scale. Weights (inverse-variance of log RR) are also shown, expressed as a percentage of the weight for all studies combined. Overall estimates of RRs, 95%CIs and weights are also shown. Studies are identified by the study reference code shown in Table 1, with sex identified by m (male), f (female) or c (sexes combined). In the graphical representation, individual RRs are indicated by a solid square, with the area of the square proportional to the weight. RRs shown with a - are calculated using a 0.5 addition to each cell, due to a zero in the 2 x 2 table. RR: Relative risk.
- Citation: Lee PN, Fry JS, Forey BA, Hamling JS, Thornton AJ. Environmental tobacco smoke exposure and lung cancer: A systematic review. World J Meta-Anal 2016; 4(2): 10-43
- URL: https://www.wjgnet.com/2308-3840/full/v4/i2/10.htm
- DOI: https://dx.doi.org/10.13105/wjma.v4.i2.10


