Copyright
©The Author(s) 2016.
World J Meta-Anal. Apr 26, 2016; 4(2): 10-43
Published online Apr 26, 2016. doi: 10.13105/wjma.v4.i2.10
Published online Apr 26, 2016. doi: 10.13105/wjma.v4.i2.10
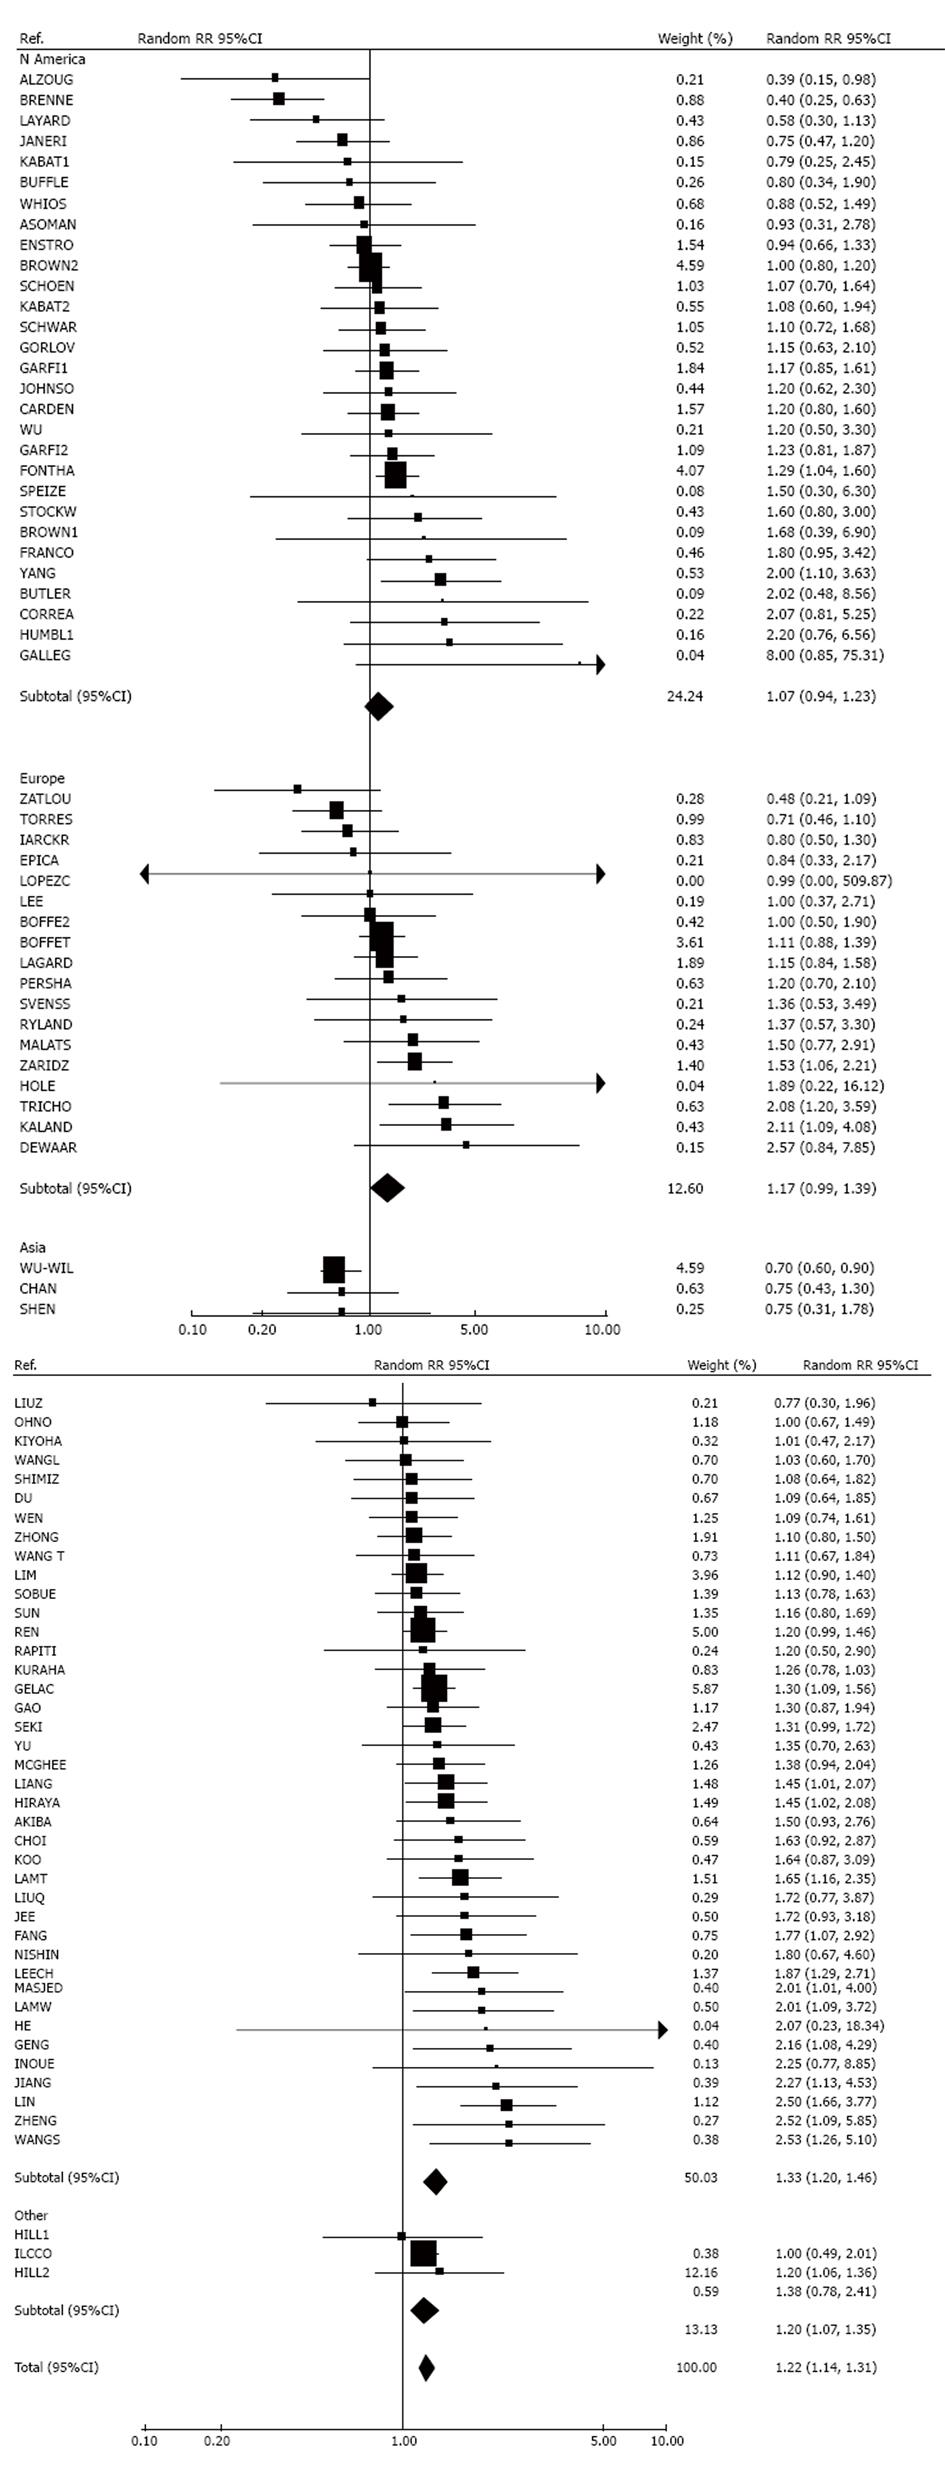
Figure 1 Forest plots for smoking by husband, by region.
Estimates of the random-effects RR and its 95%CI are shown separately by region, sorted in increasing order of RR. These are shown numerically, and also graphically on a logarithmic scale. Weights (inverse-variance of log RR) are also shown, expressed as a percentage of the weight for all studies combined. Estimates of RRs, 95%CIs and weights are also shown for each region combined and overall. Studies are identified by the study reference code shown in Table 1. In the graphical representation, individual RRs are indicated by a solid square, with the area of the square proportional to the weight. RR: Relative risk.
- Citation: Lee PN, Fry JS, Forey BA, Hamling JS, Thornton AJ. Environmental tobacco smoke exposure and lung cancer: A systematic review. World J Meta-Anal 2016; 4(2): 10-43
- URL: https://www.wjgnet.com/2308-3840/full/v4/i2/10.htm
- DOI: https://dx.doi.org/10.13105/wjma.v4.i2.10


