Copyright
©The Author(s) 2015.
World J Meta-Anal. Feb 26, 2015; 3(1): 54-60
Published online Feb 26, 2015. doi: 10.13105/wjma.v3.i1.54
Published online Feb 26, 2015. doi: 10.13105/wjma.v3.i1.54
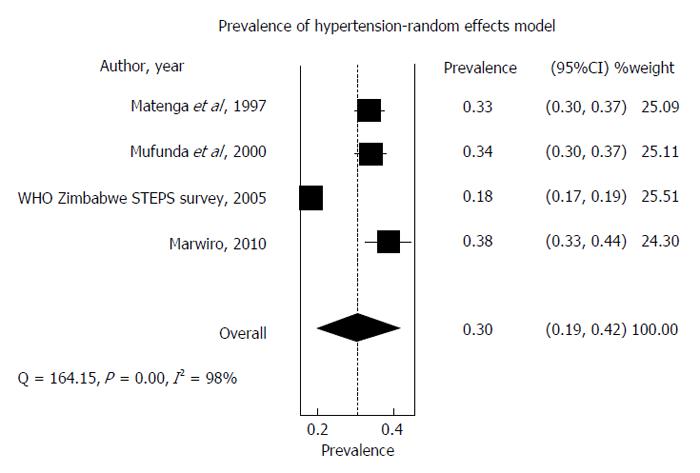
Figure 2 Forest plot of studies conducted from 1997 to 2010 on Hypertension prevalence.
The forest plot depicted in Figure 2 (above) represents a meta-analysis of studies that measured the prevalence of hypertension in Zimbabwe from 1997 to 2010. Individual studies with their unadjusted prevalence are represented by a black square and a horizontal line, which corresponds to the point estimate and 95%CI of prevalence. The size of the black square reflects the weight of the study in the meta-analysis. The diamond at the bottom represents the pooled estimate of all studies with its 95% confidence interval. In this case, Figure 2 indicates the pooled estimated prevalence of hypertension is 30% (95%CI: 19-42). The test for overall prevalence also indicates statistical significance (P < 0.0001).
- Citation: Mutowo MP, Mangwiro JC, Lorgelly P, Owen A, Renzaho AM. Hypertension in Zimbabwe: A meta-analysis to quantify its burden and policy implications. World J Meta-Anal 2015; 3(1): 54-60
- URL: https://www.wjgnet.com/2308-3840/full/v3/i1/54.htm
- DOI: https://dx.doi.org/10.13105/wjma.v3.i1.54


