Copyright
©The Author(s) 2024.
World J Clin Cases. Jan 26, 2024; 12(3): 587-595
Published online Jan 26, 2024. doi: 10.12998/wjcc.v12.i3.587
Published online Jan 26, 2024. doi: 10.12998/wjcc.v12.i3.587
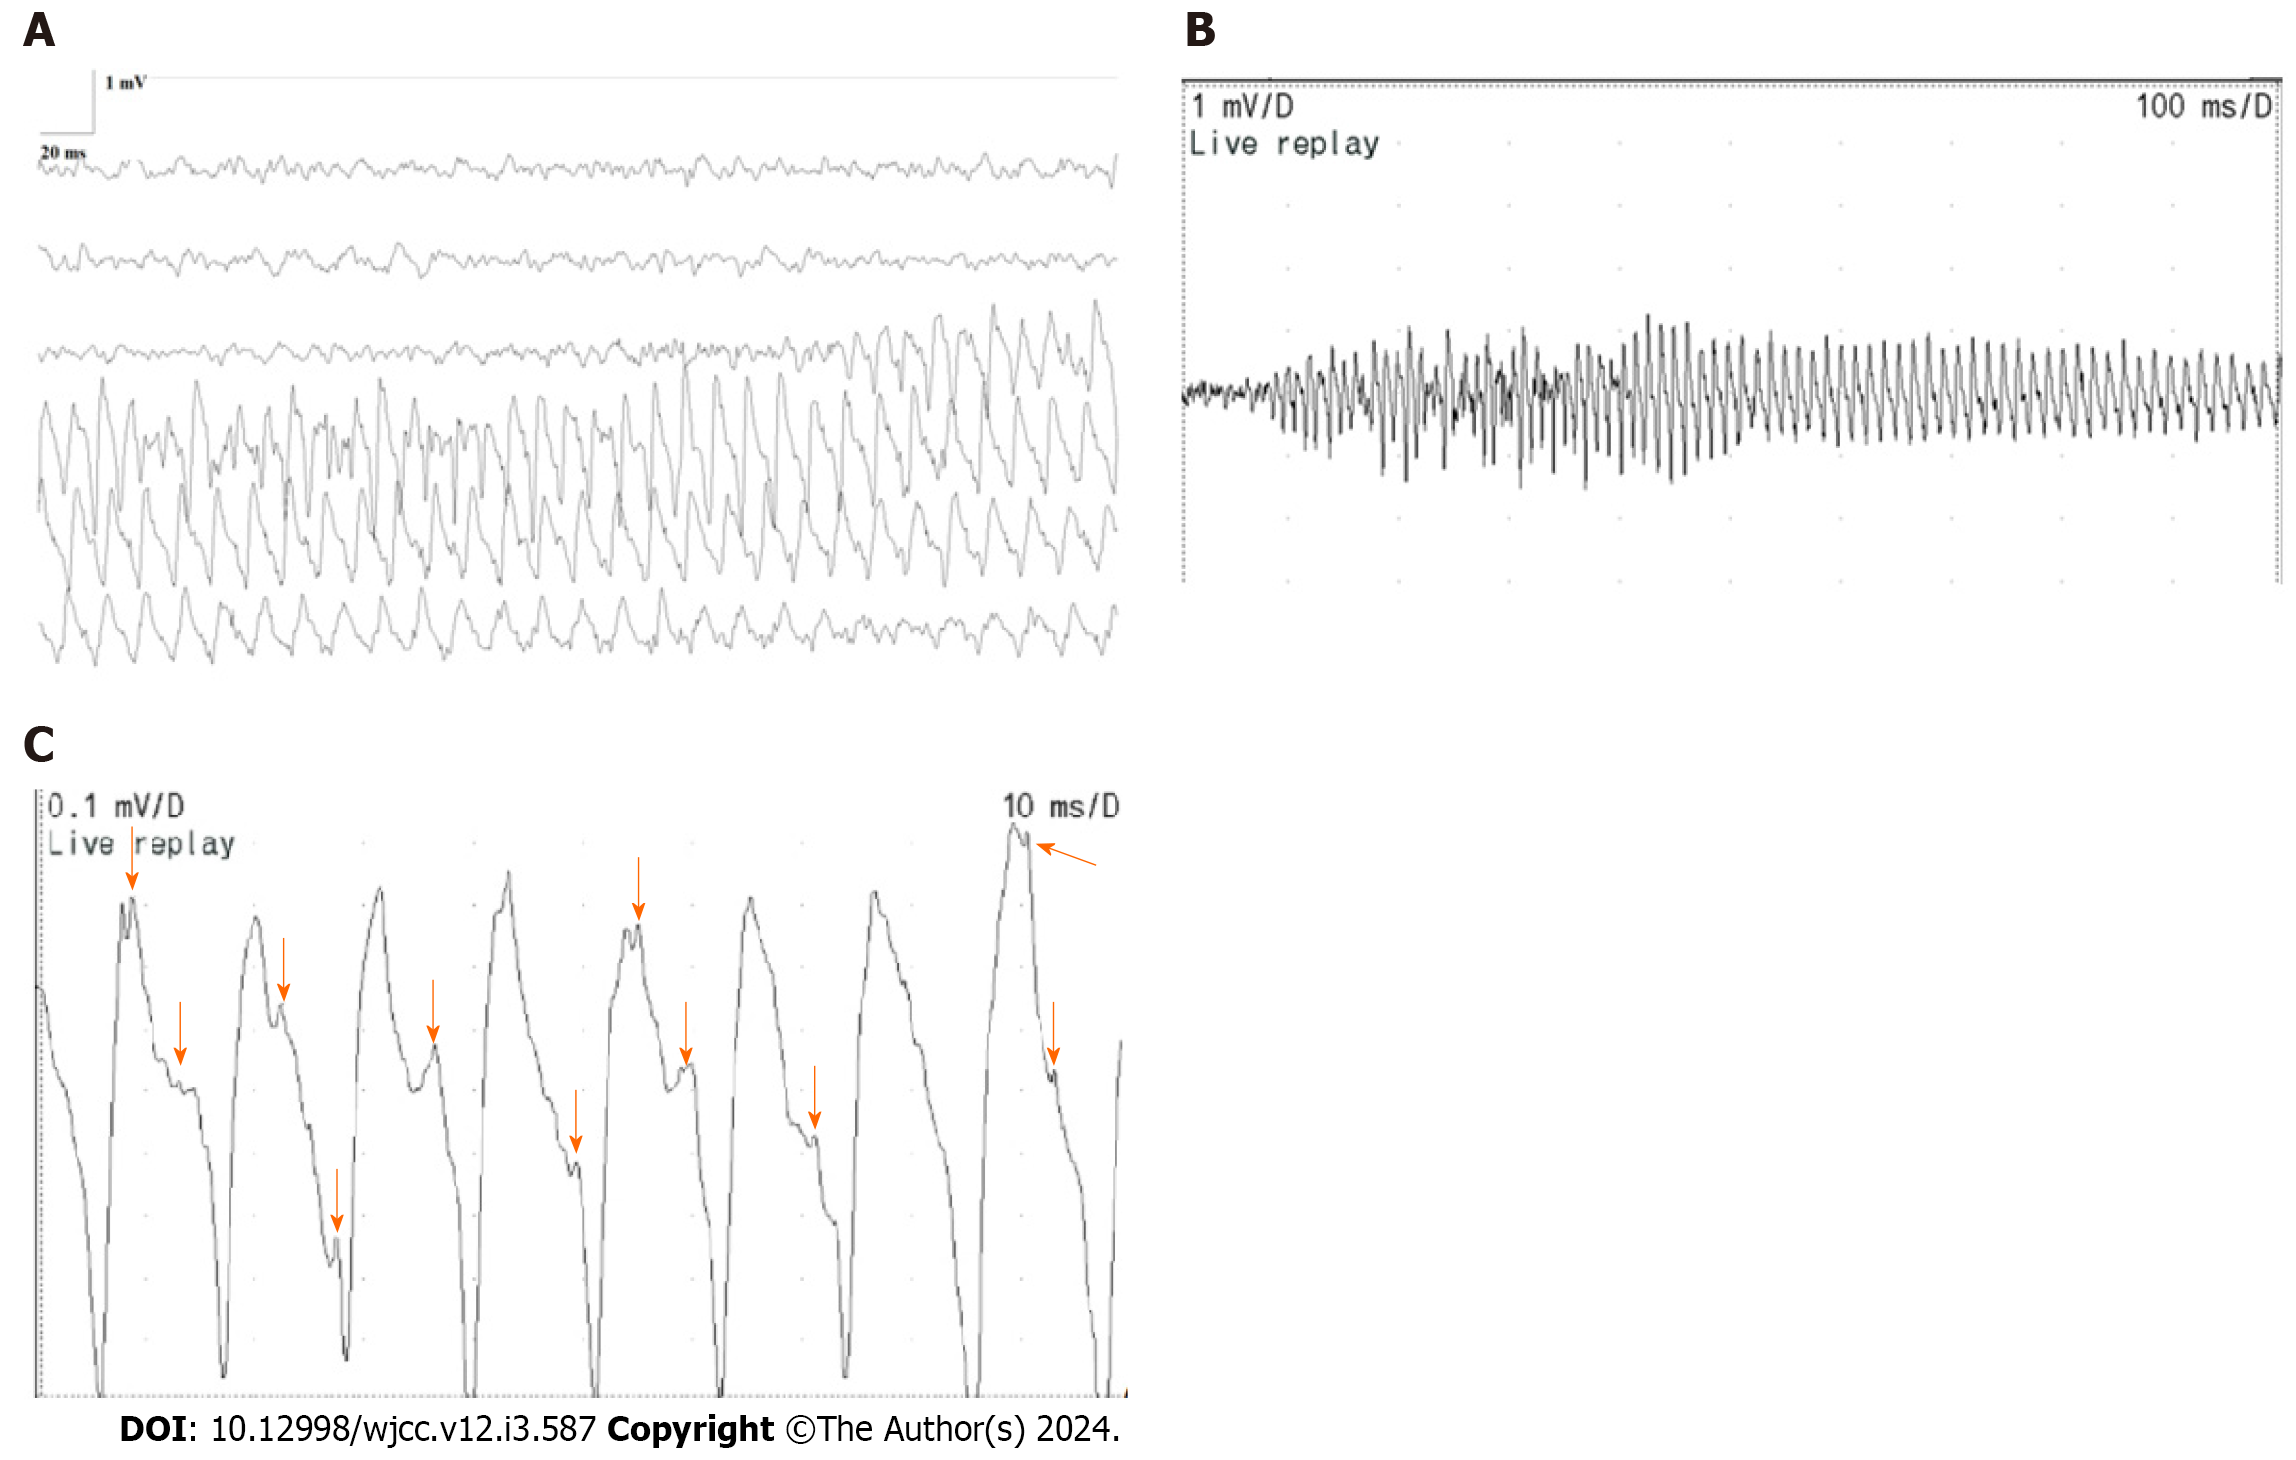
Figure 1 Right rectus femoris (horizontal bar 20 ms/D, vertical bar 1 mV/D; horizontal bar 100 ms/D, vertical bar 1 mV/D; and horizontal bar 10 ms/D, vertical bar 0.
1 mV/D). A: Right rectus femoris (horizontal bar 20 ms/D, vertical bar 1 mV/D). The train of positive waves in myotonic discharges, displaying fluctuations in frequency and amplitude, with a frequency range of 70-150 Hz and an amplitude range of 0.5-3 mV, is depicted; B: Right rectus femoris (horizontal bar 100 ms/D, vertical bar 1 mV/D). A section of the train of positive waves in myotonic discharges showcases an oscillating pattern in amplitude and frequency, characterized by a rapid surge followed by a gradual decline; C: Right rectus femoris (horizontal bar 10 ms/D, vertical bar 0.1 mV/D). This represents a small section of the train of positive waves within myotonic discharge depicted in Figure 1B. A complete positive wave is visible, and the arrows denote the presence of negative phase waves, each exhibiting varying frequencies and shapes.
- Citation: Yi H, Liu CX, Ye SX, Liu YL. Special electromyographic features in a child with paramyotonia congenita: A case report and review of literature. World J Clin Cases 2024; 12(3): 587-595
- URL: https://www.wjgnet.com/2307-8960/full/v12/i3/587.htm
- DOI: https://dx.doi.org/10.12998/wjcc.v12.i3.587


