Copyright
©The Author(s) 2022.
World J Clin Cases. Oct 26, 2022; 10(30): 10984-10996
Published online Oct 26, 2022. doi: 10.12998/wjcc.v10.i30.10984
Published online Oct 26, 2022. doi: 10.12998/wjcc.v10.i30.10984
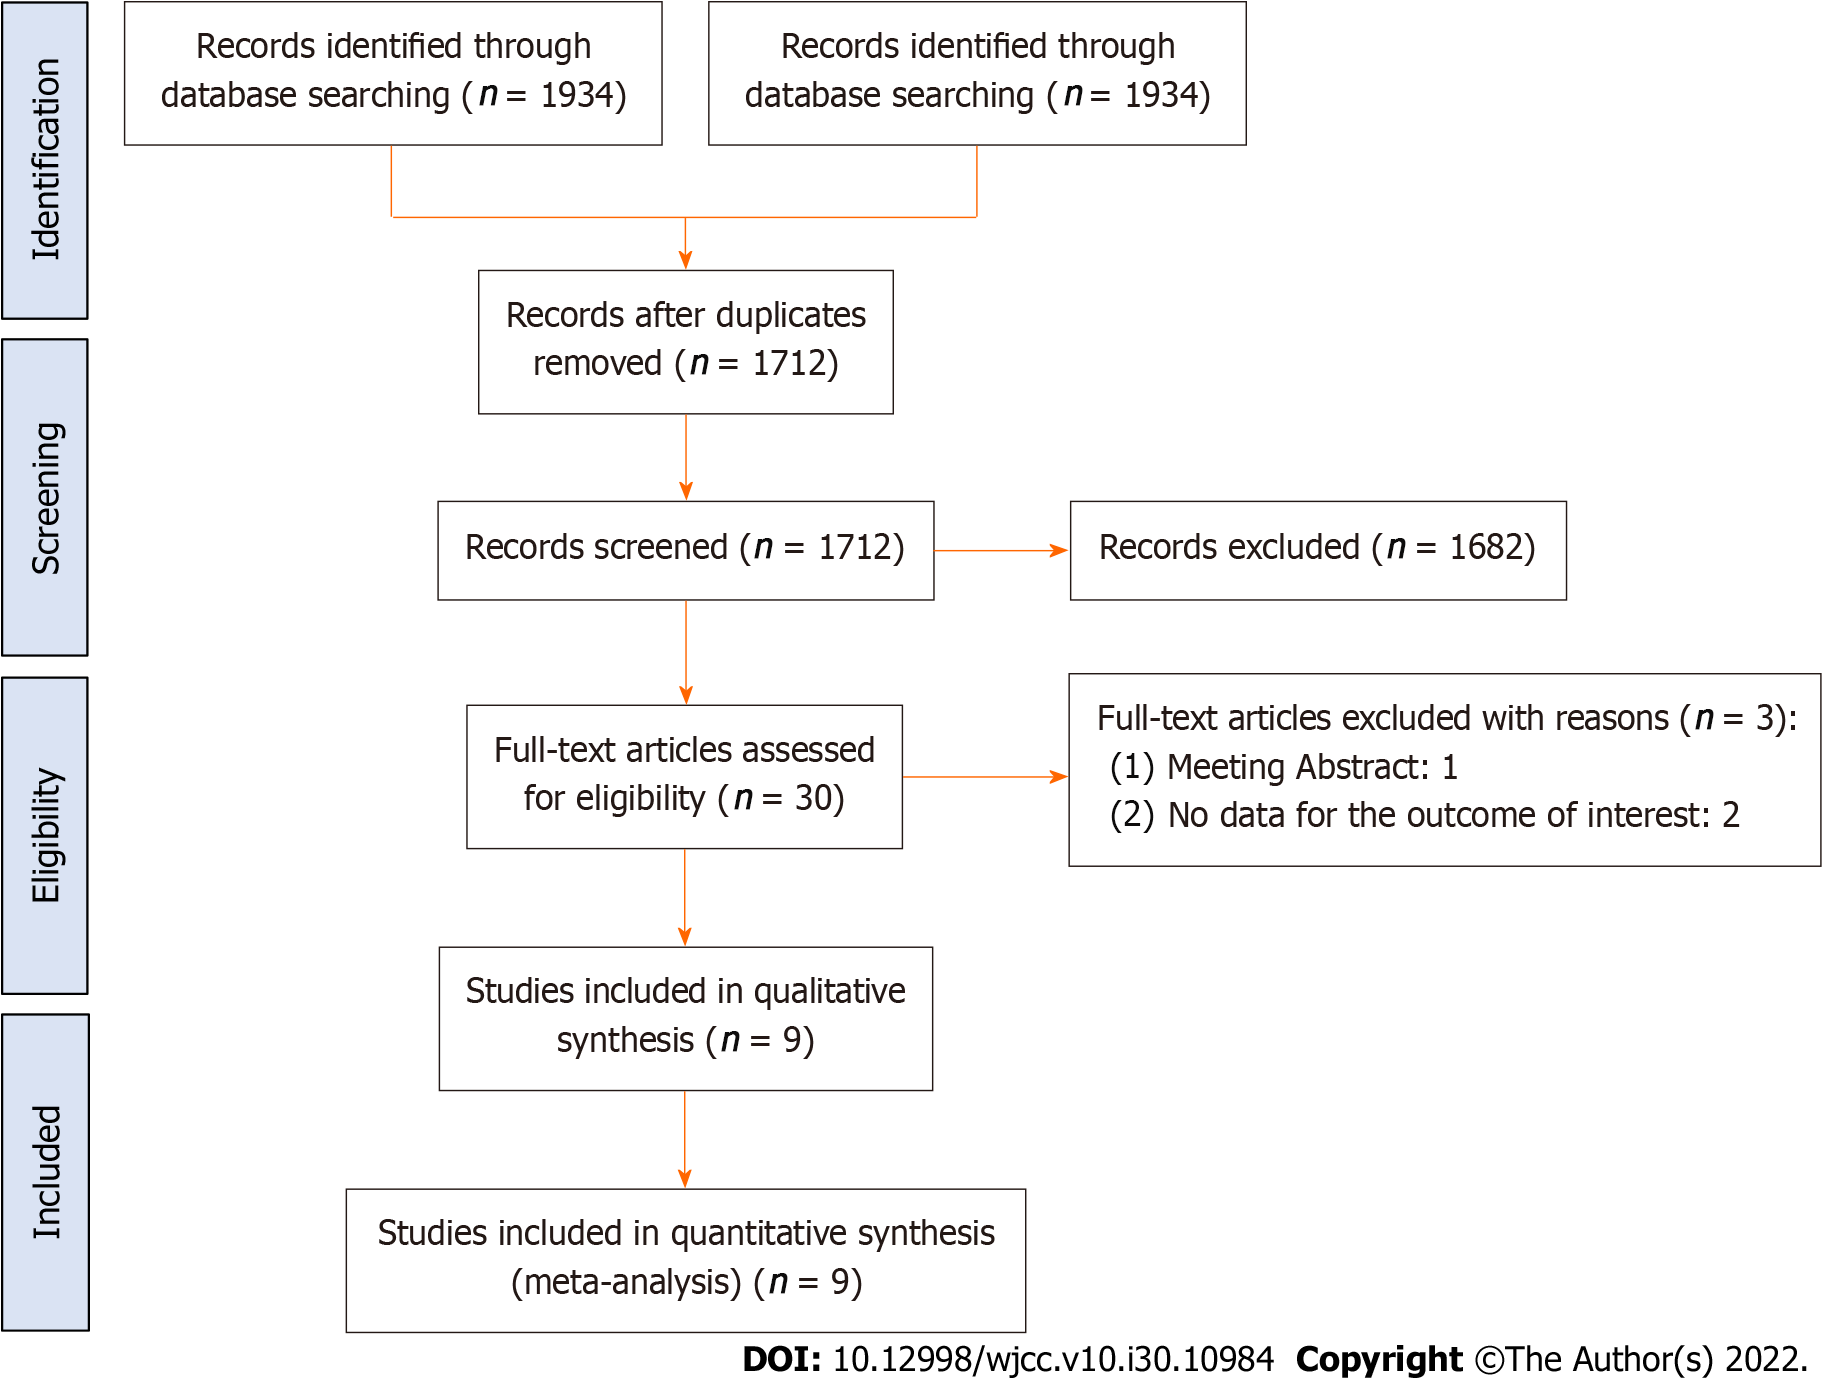
Figure 1 Flow chart of the literature search and study selection.
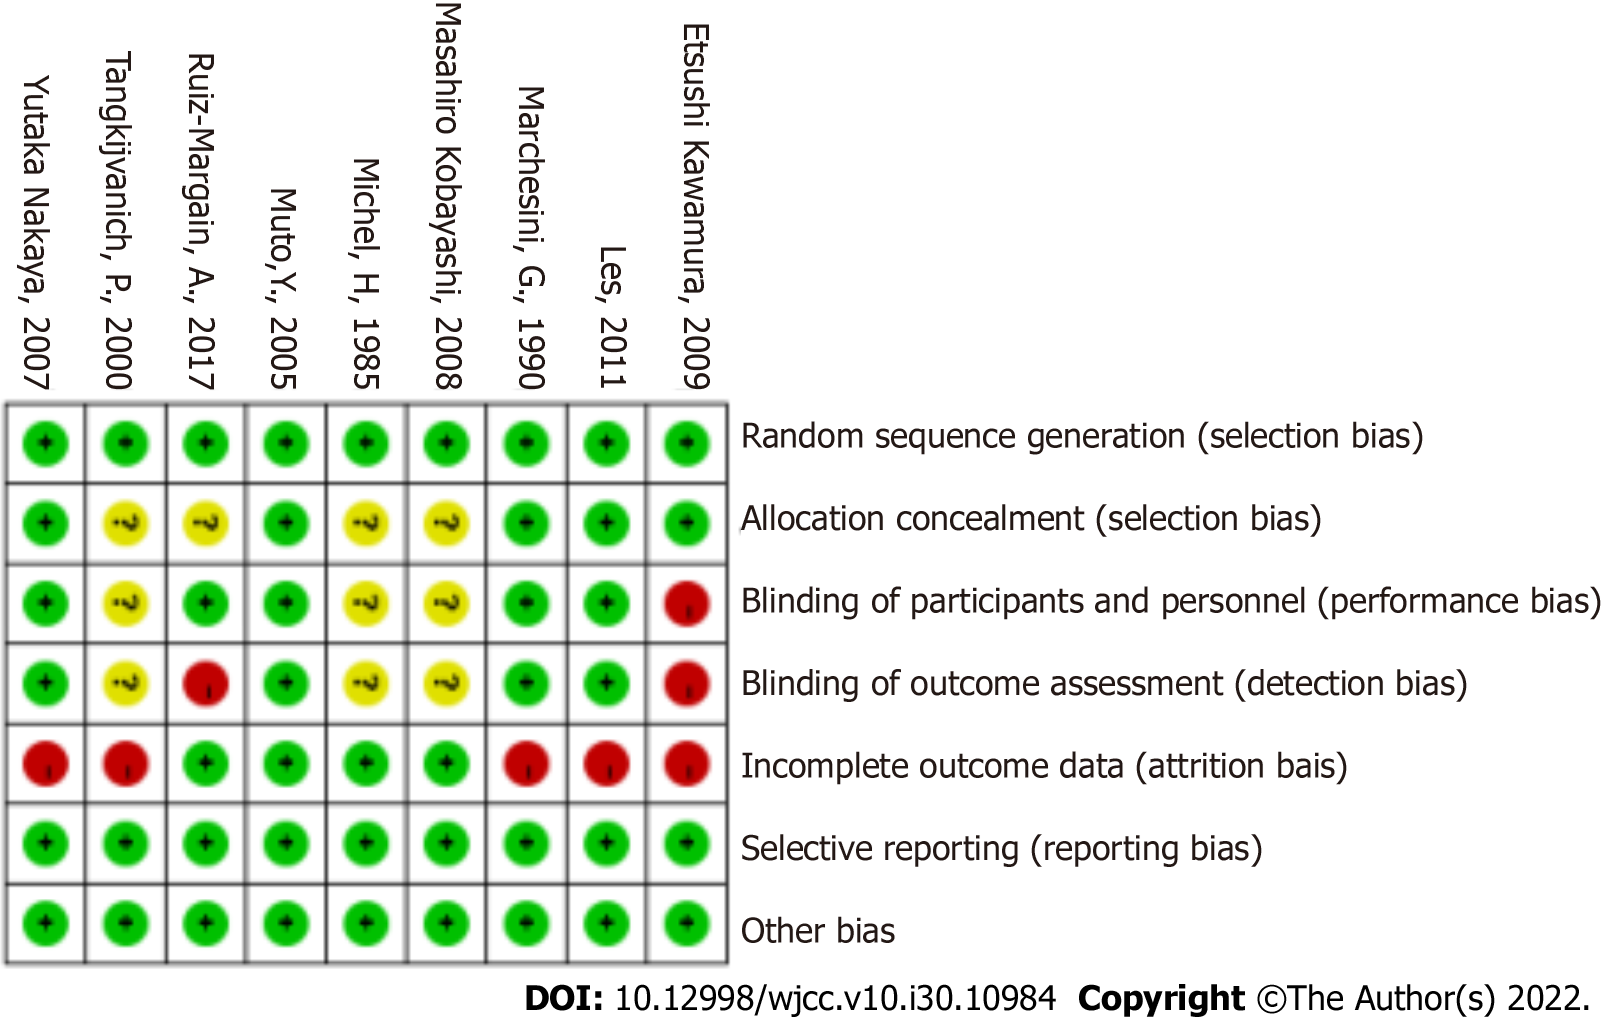
Figure 2 Risk of bias summary of all studies.
Figure 3 Forest plots of the meta-analysis of the complication rate.
BCAA: Branched-chain amino acids; N: Number; CI: Confidence interval; I2: I-square.
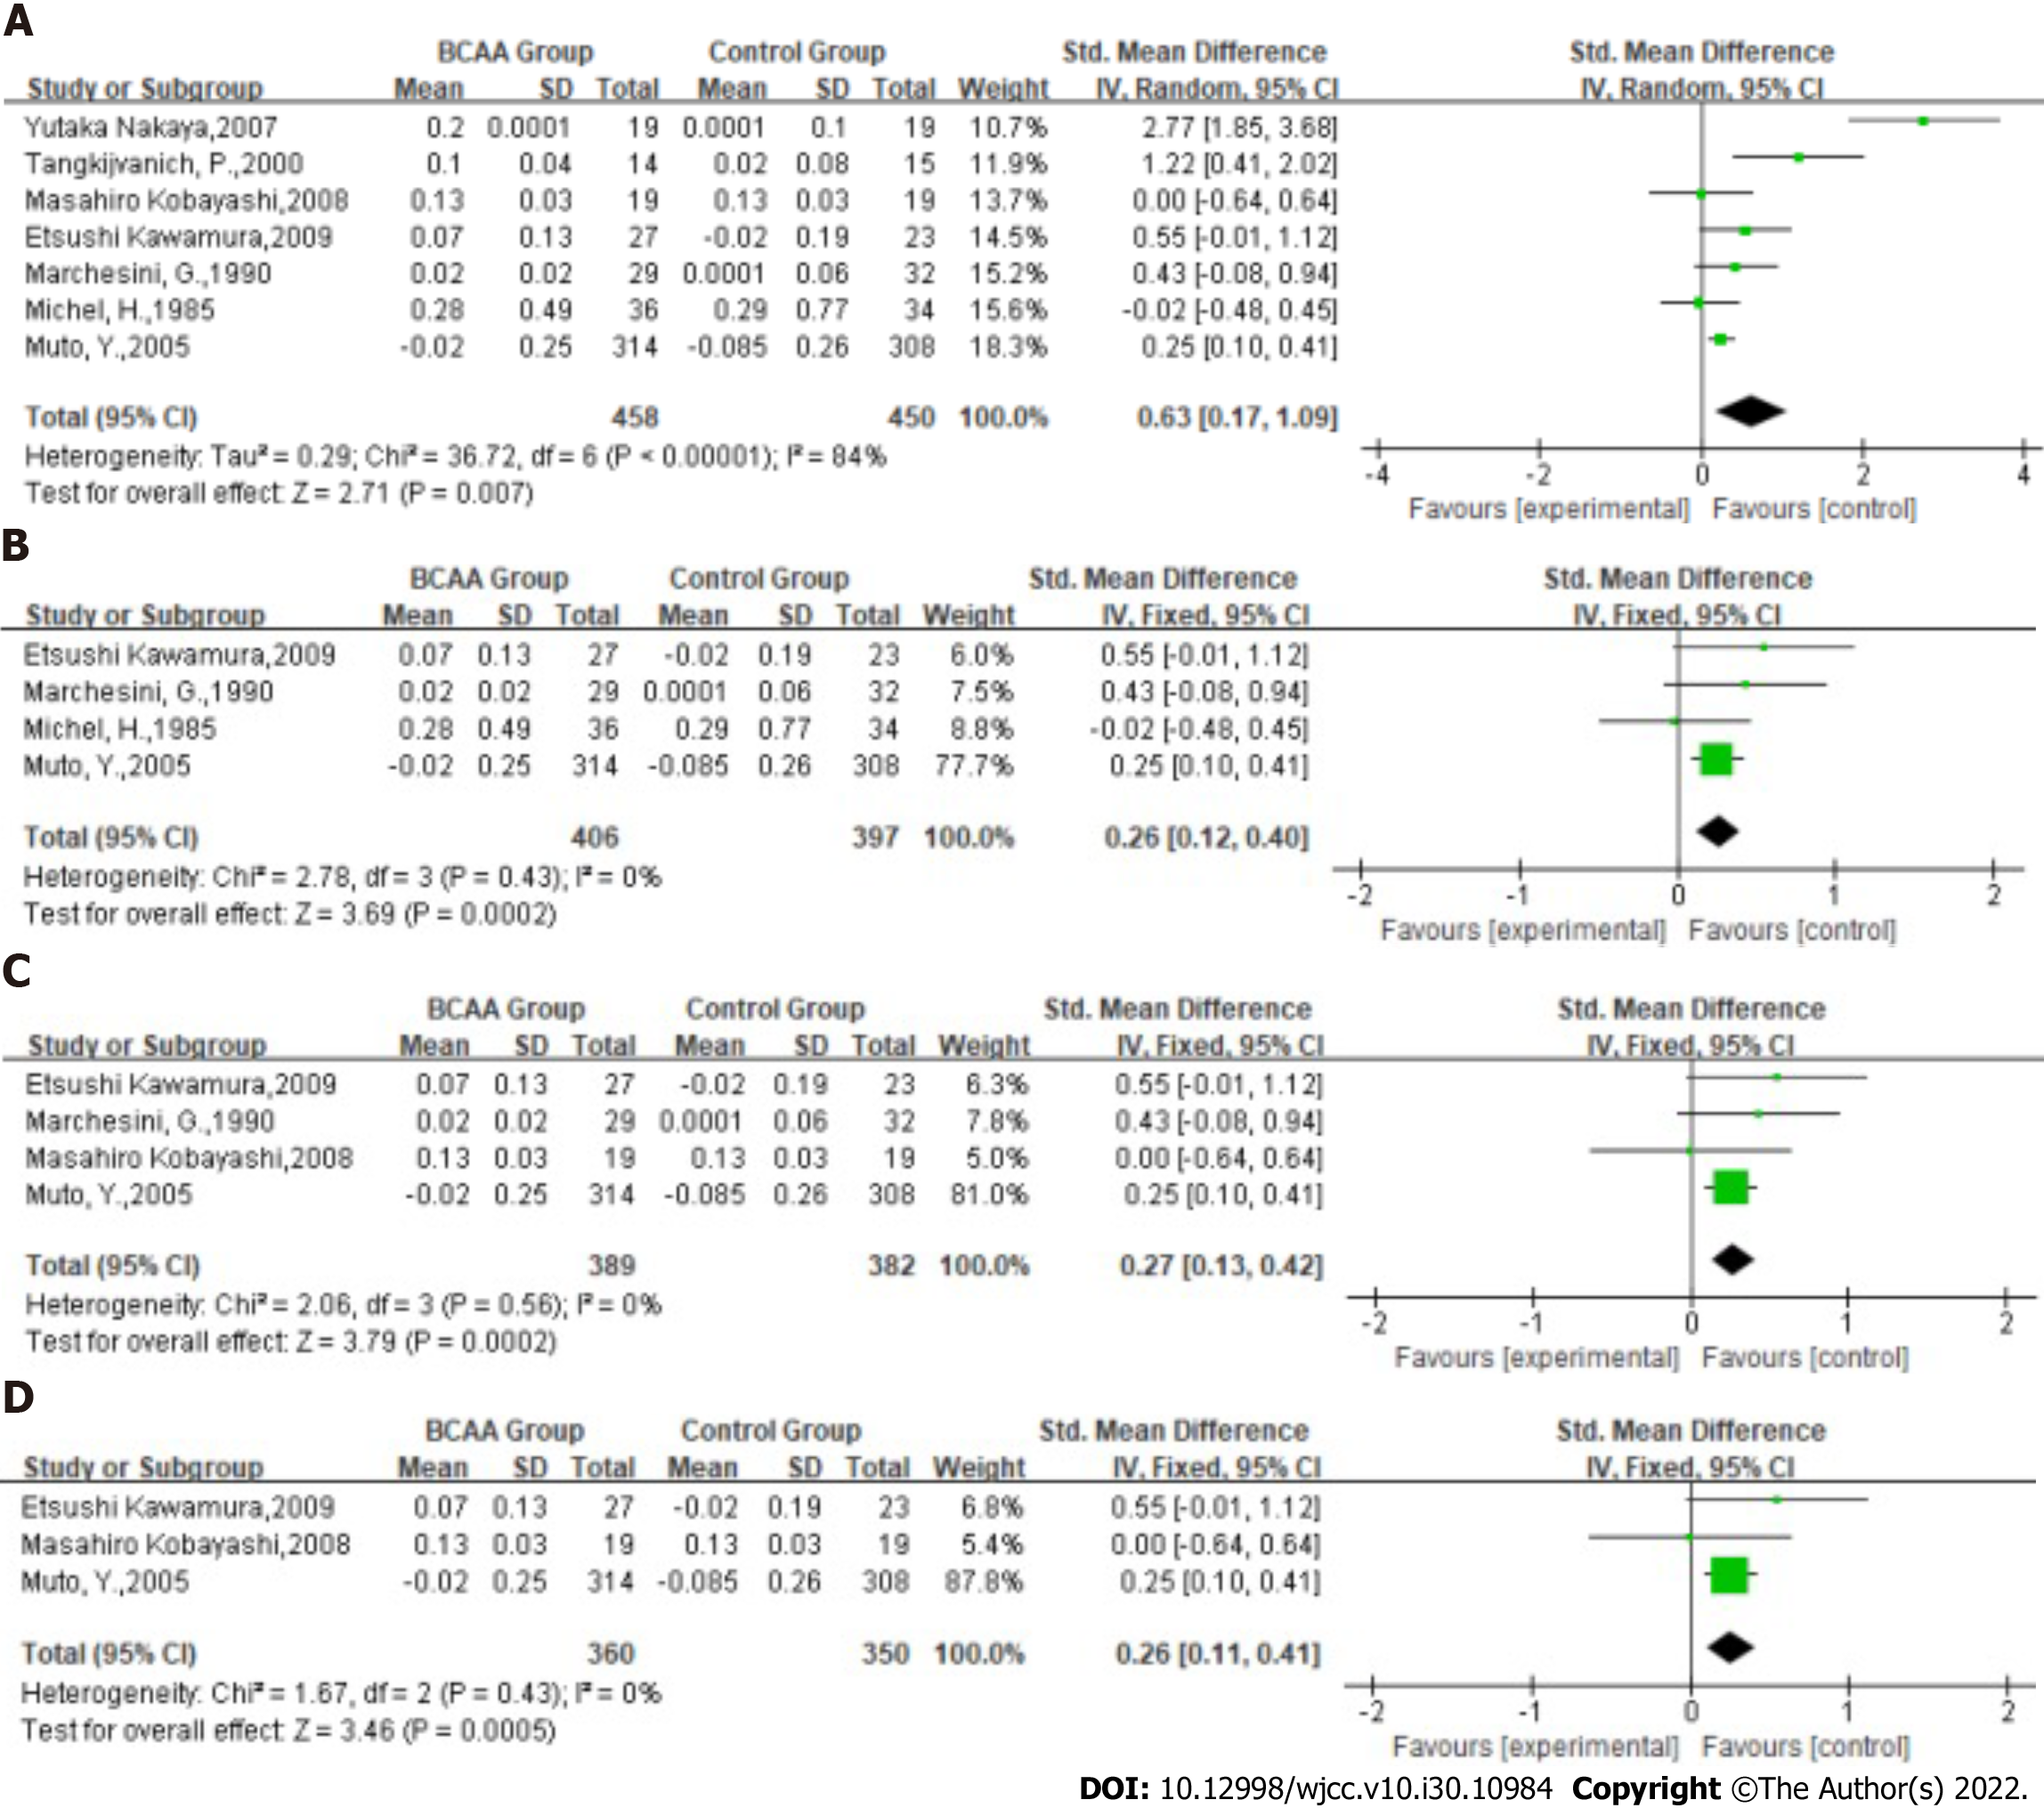
Figure 4 Forest plots.
A: Forest plots of the meta-analysis of the albumin level; B: Forest plots of subgroup analysis of the albumin level (studies with a total number of patients less than 50 were excluded); C: Forest plots of subgroup analysis of the albumin level (studies with treatment duration greater than 3 mo were excluded); D: Forest plots of subgroup analysis of the albumin level (among the included studies, the majority of patients had Child grade A or B and treatment duration was greater than 3 mo). BCAA: Branched-chain amino acids; N: Number; CI: Confidence interval; SMD: Standard mean difference; I2: I-square.
Figure 5 Forest plots of the meta-analysis of the aspartate aminotransferase level.
BCAA: Branched-chain amino acids; N: Number; CI: Confidence interval; SMD: Standard mean difference; I2: I-square.
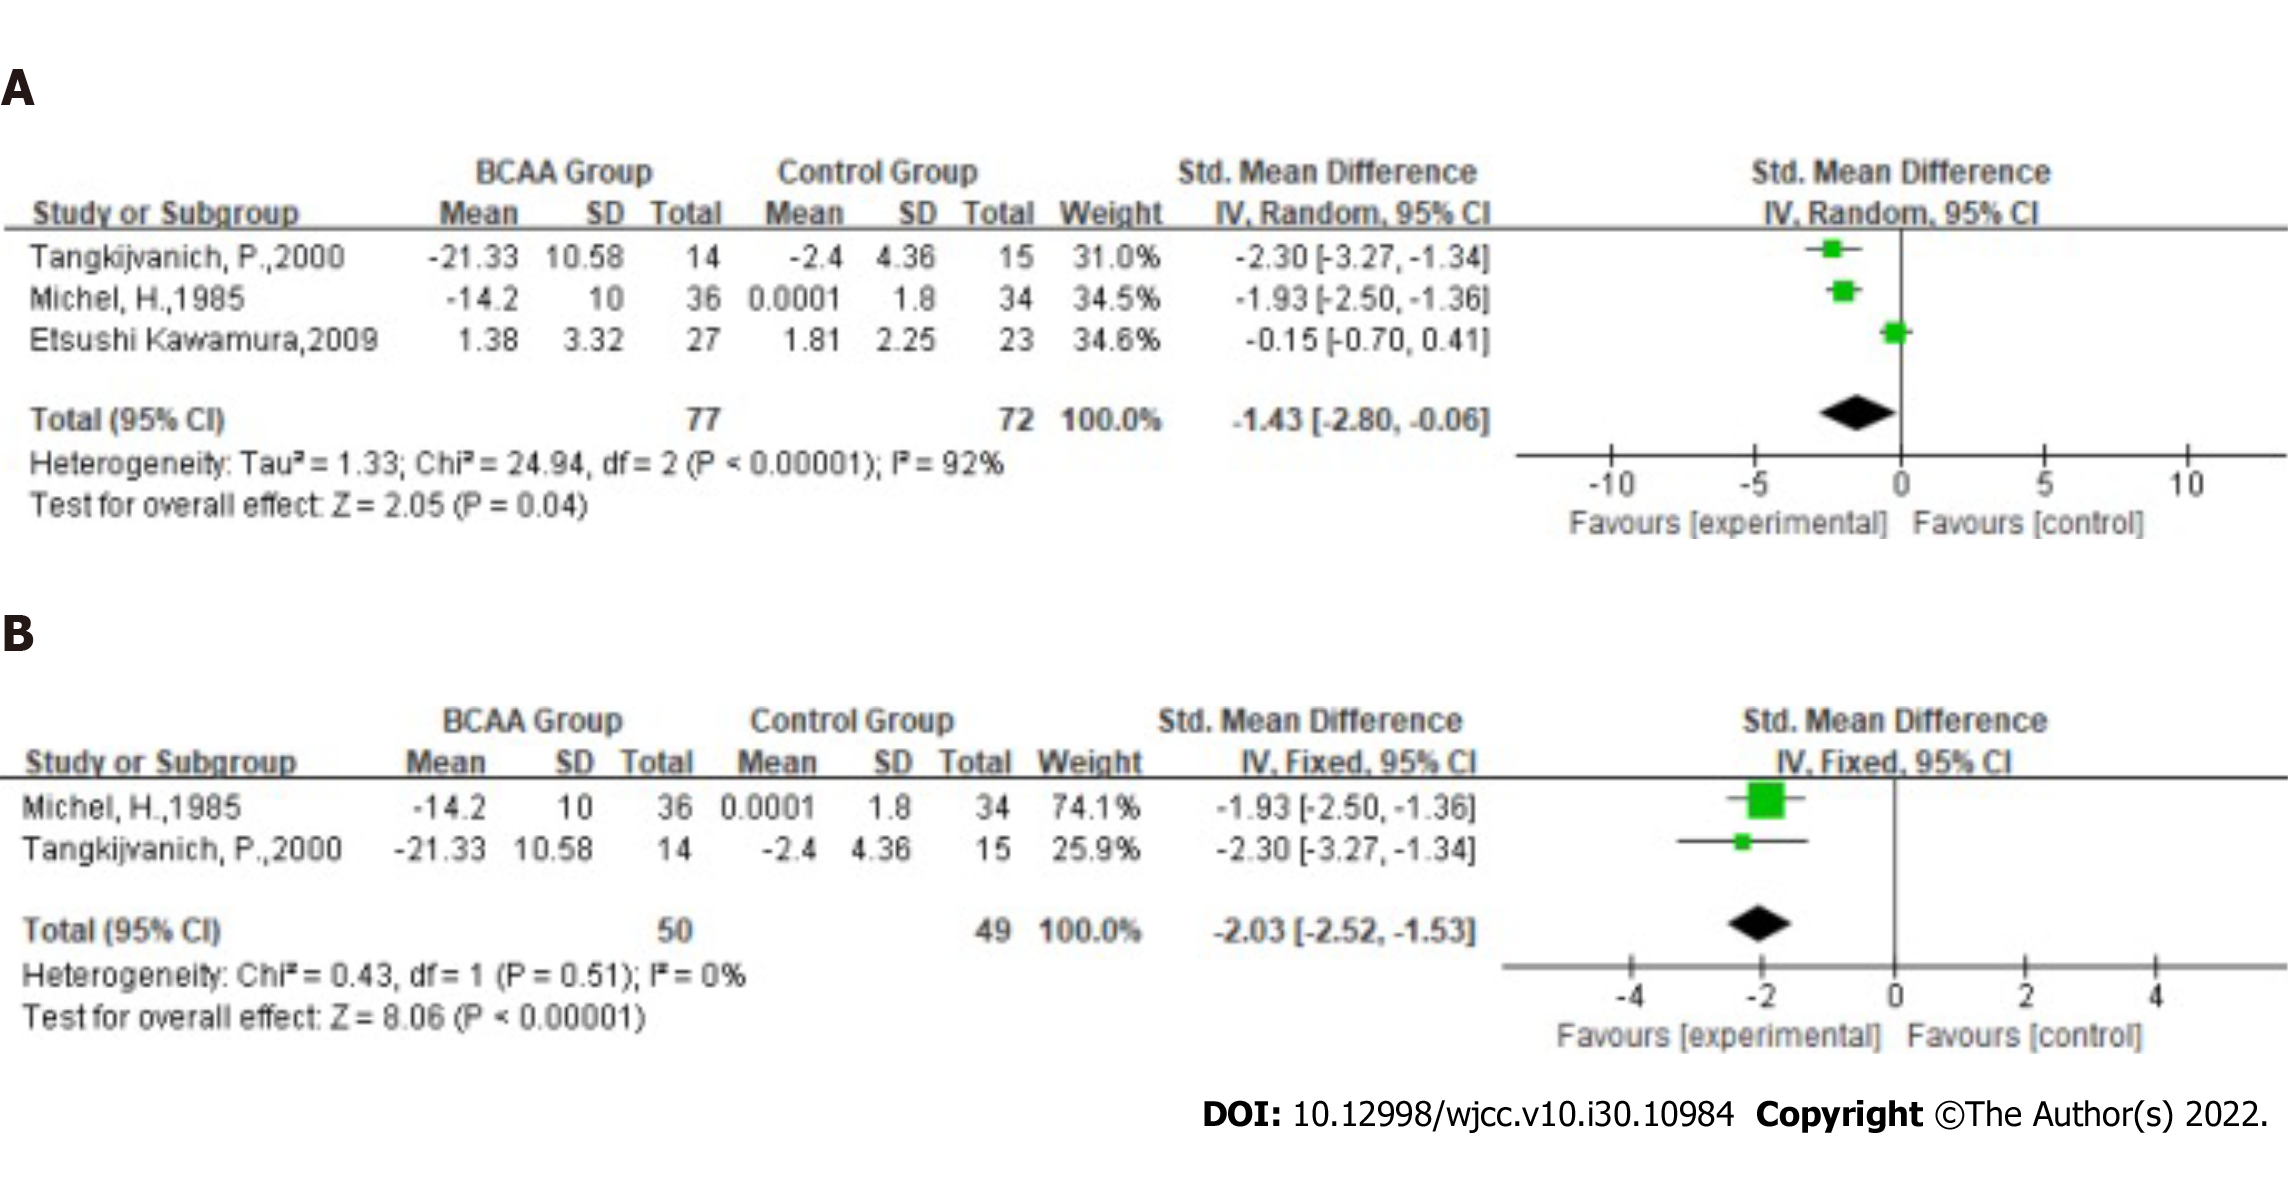
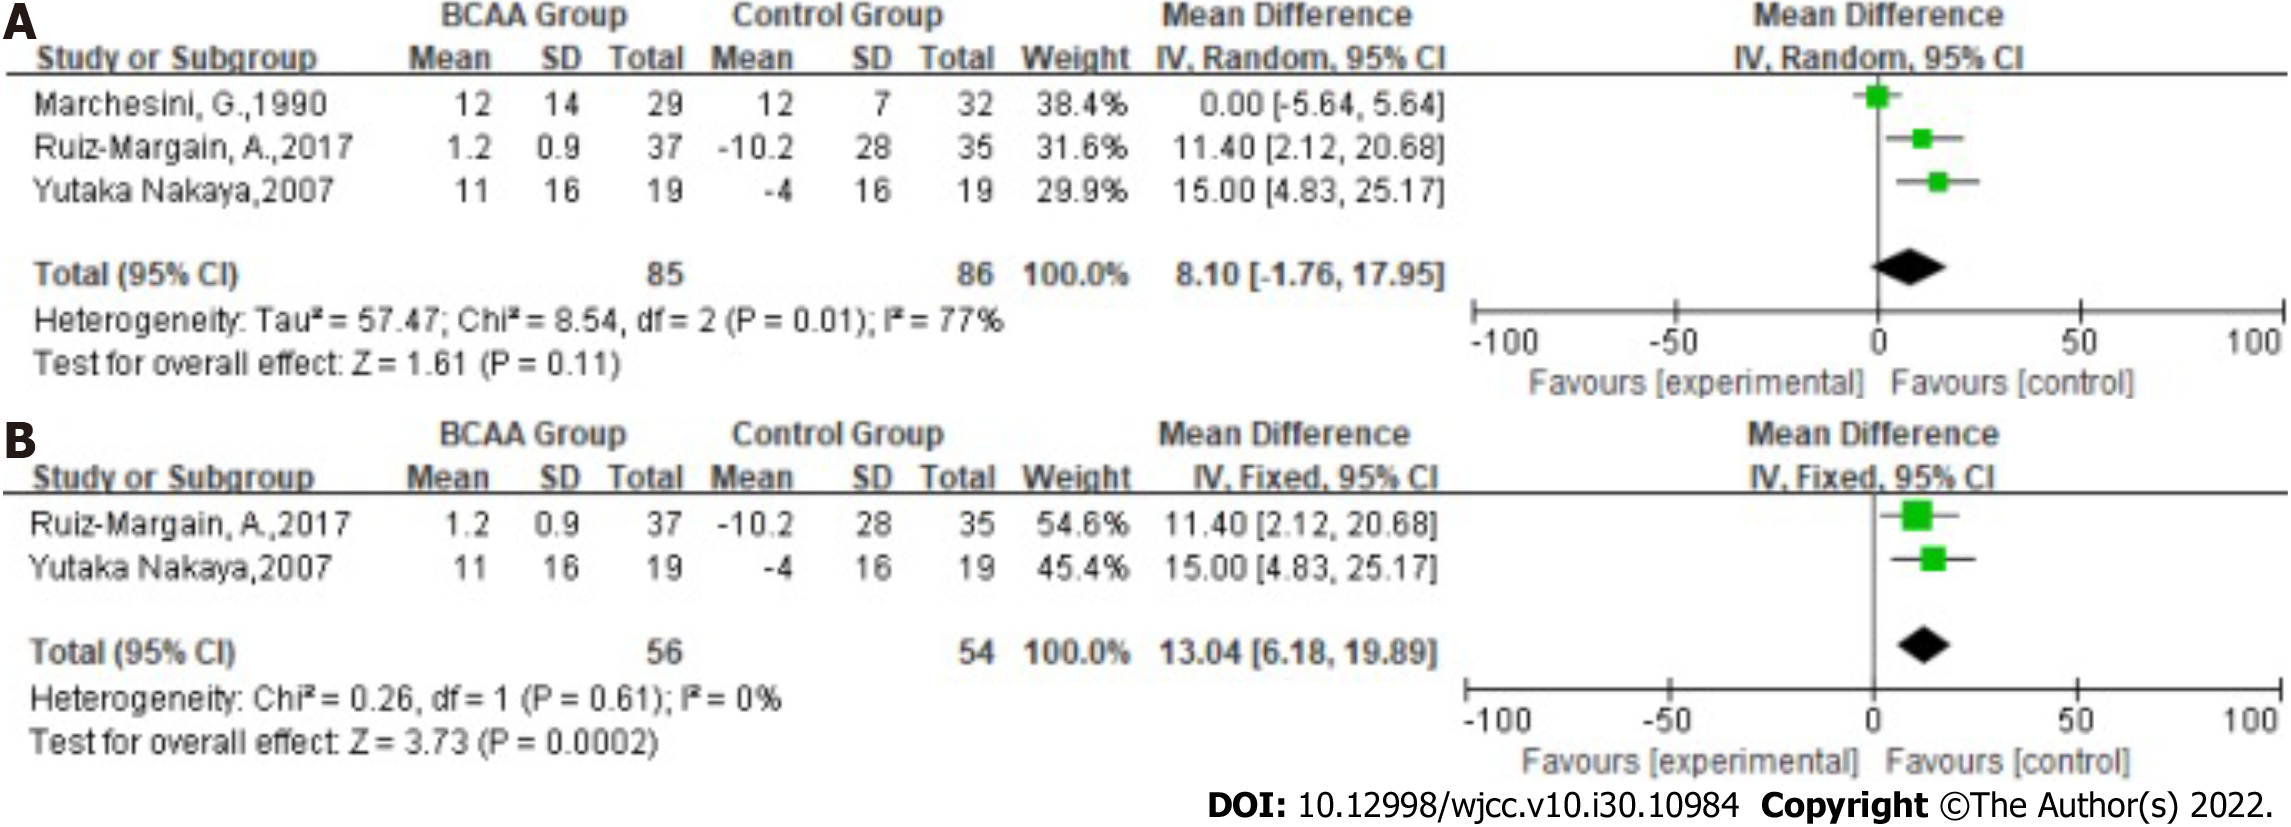
Figure 6 Forest plots.
A: Forest plots of the meta-analysis of the alanine transaminase (ALT) level; B: Forest plots of subgroup analysis of the ALT level (Kawamura et al[19]’s study was excluded). BCAA: Branched-chain amino acids; N: Number; CI: Confidence interval; SMD: Standard mean difference; I2: I-square.
Figure 7 Forest plots of the meta-analysis of the bilirubin level.
BCAA: Branched-chain amino acids; N: Number; CI: Confidence interval; SMD: Standard mean difference; I2: I-square.
Figure 8 Forest plots.
A: Forest plots of the meta-analysis of the glucose level; B: Forest plots of subgroup analysis of the glucose level (the Child grade of the patients in the included studies was A or B). BCAA: Branched-chain amino acids; N: Number; CI: Confidence interval; SMD: Standard mean difference; I2: I-square.
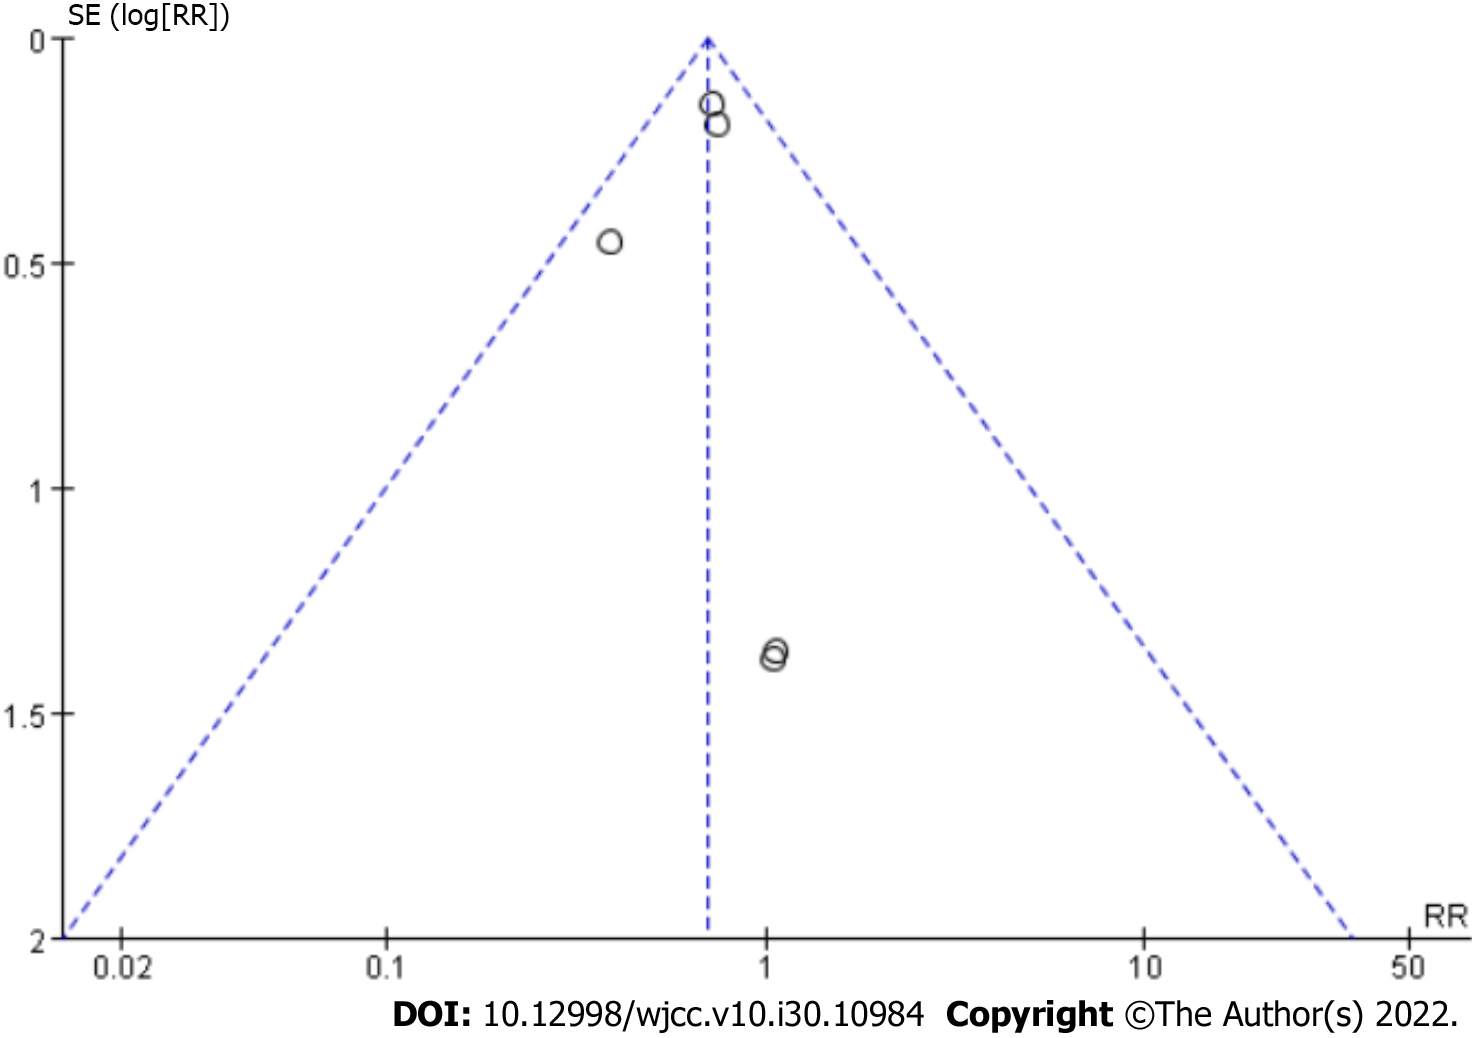
Figure 9 Publication bias.
- Citation: Du JY, Shu L, Zhou YT, Zhang L. Branched-chain amino acids supplementation has beneficial effects on the progression of liver cirrhosis: A meta-analysis. World J Clin Cases 2022; 10(30): 10984-10996
- URL: https://www.wjgnet.com/2307-8960/full/v10/i30/10984.htm
- DOI: https://dx.doi.org/10.12998/wjcc.v10.i30.10984


