Copyright
©The Author(s) 2022.
World J Clin Cases. Jul 16, 2022; 10(20): 6927-6935
Published online Jul 16, 2022. doi: 10.12998/wjcc.v10.i20.6927
Published online Jul 16, 2022. doi: 10.12998/wjcc.v10.i20.6927
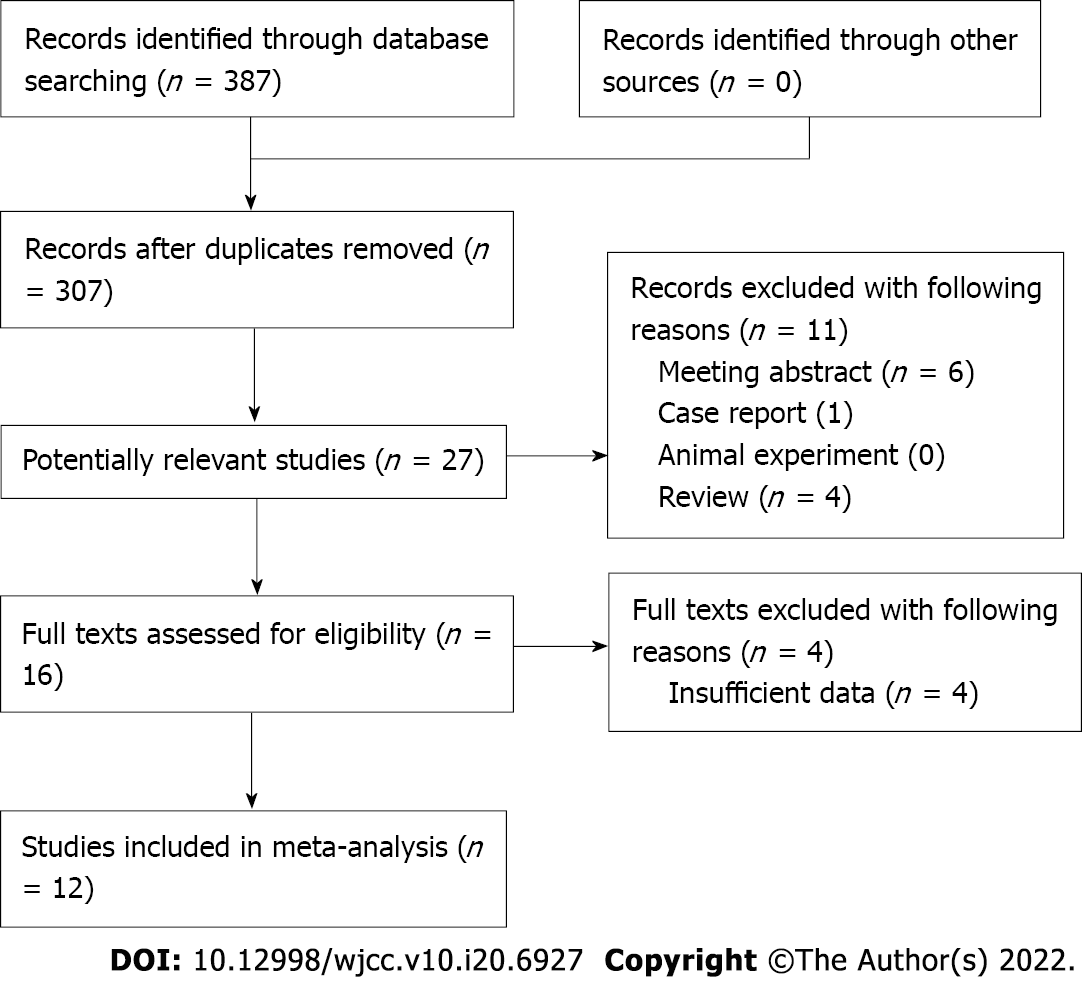
Figure 1 Flow diagram of the meta-analysis.
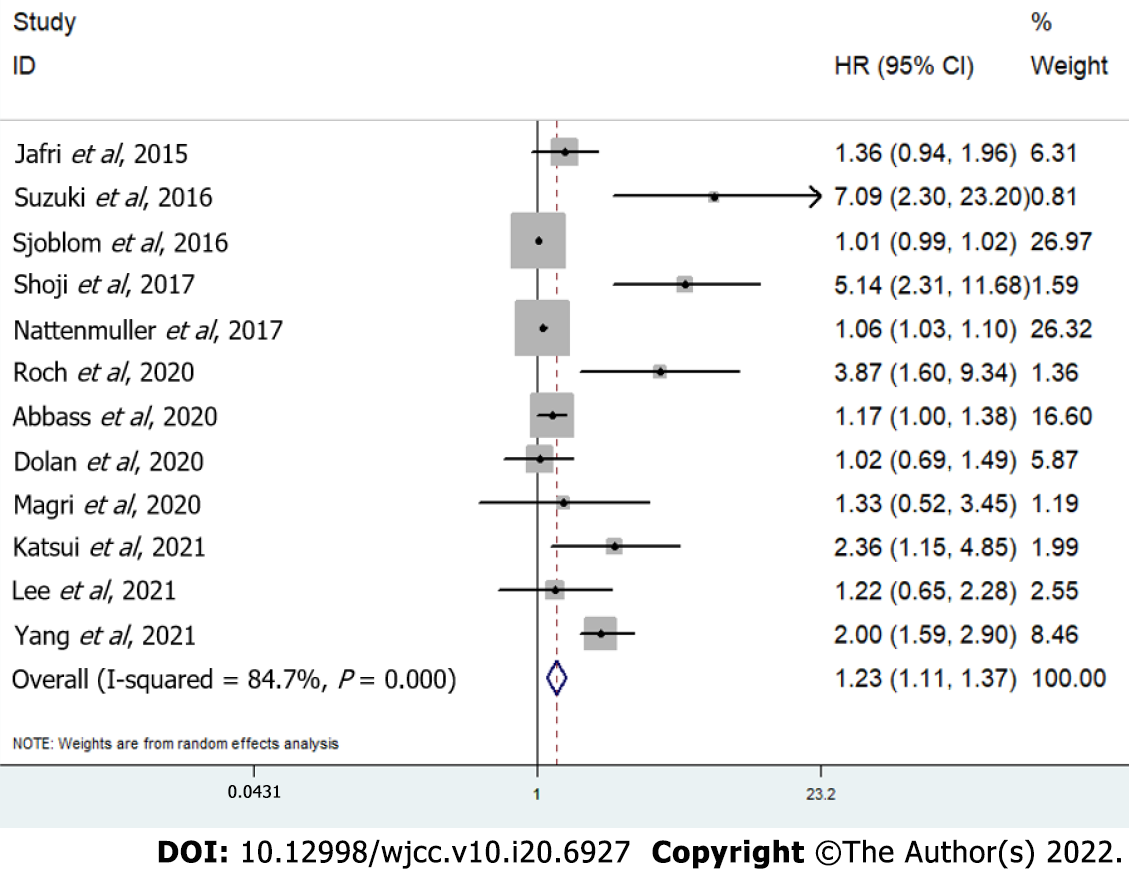
Figure 2 Forest plot for association between skeletal muscle mass index and overall survival of lung cancer patients.
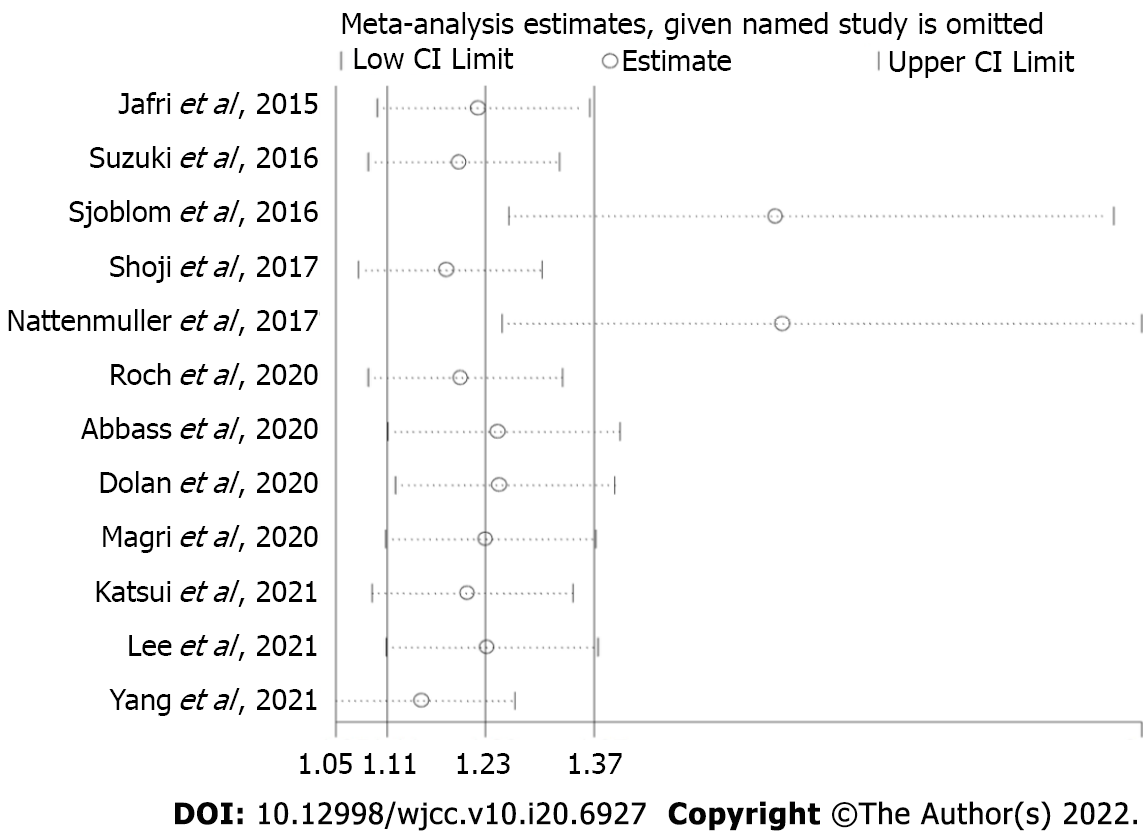
Figure 3 Sensitivity analysis of association between skeletal muscle mass index and overall survival of lung cancer patients.
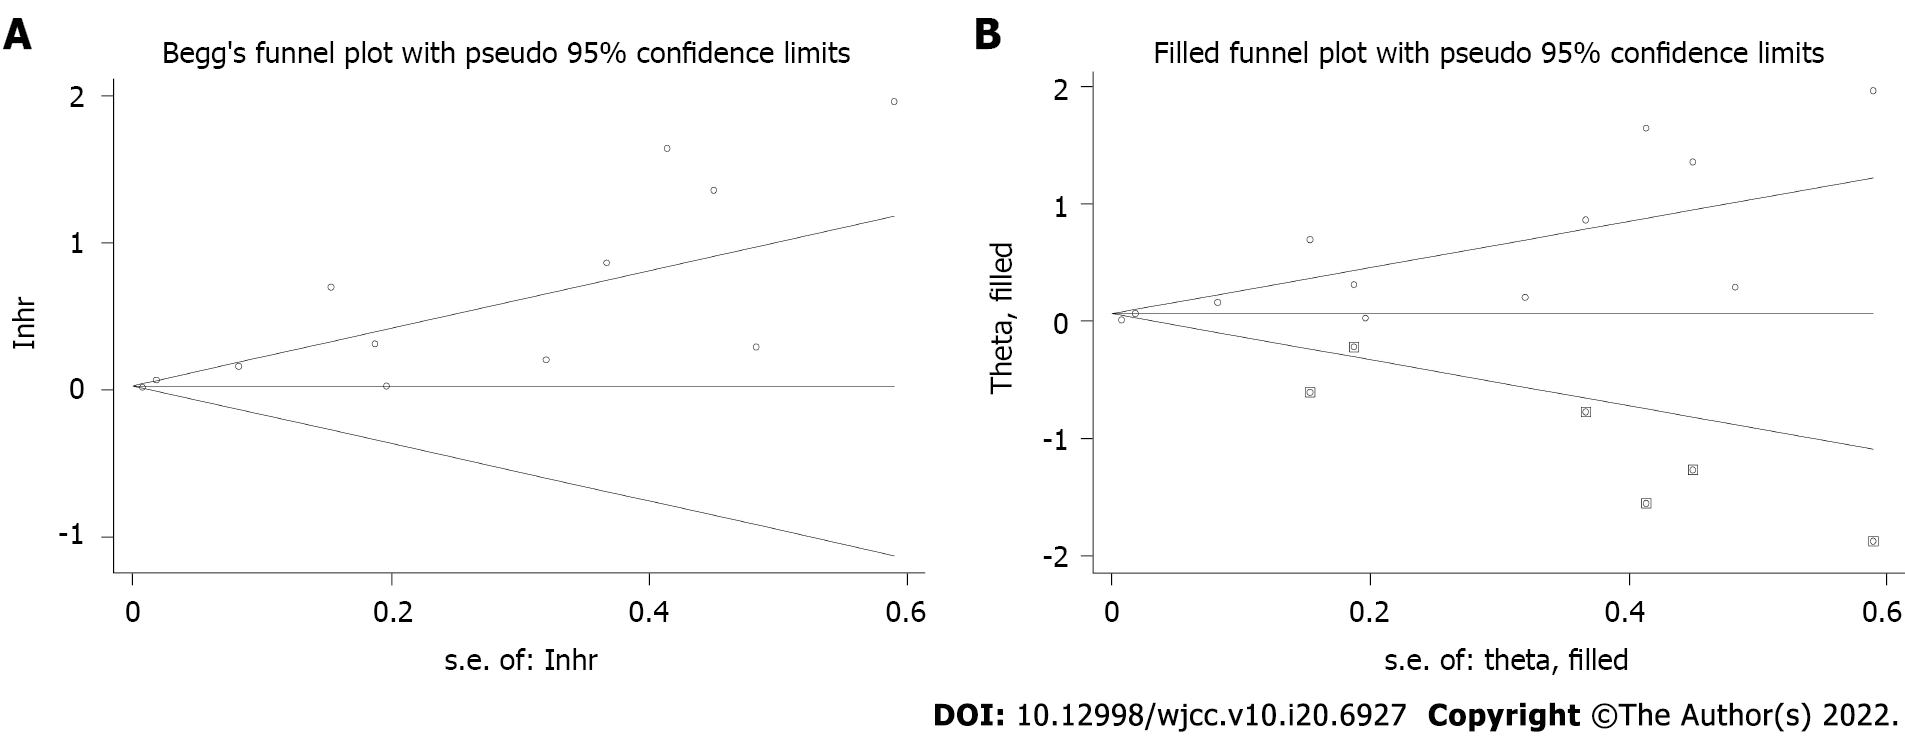
Figure 4 Association between skeletal muscle mass index and overall survival of lung cancer patients.
A: Begg’s funnel plot; B: Filled funnel plot.
- Citation: Pan XL, Li HJ, Li Z, Li ZL. Prognostic value of computed tomography derived skeletal muscle mass index in lung cancer: A meta-analysis. World J Clin Cases 2022; 10(20): 6927-6935
- URL: https://www.wjgnet.com/2307-8960/full/v10/i20/6927.htm
- DOI: https://dx.doi.org/10.12998/wjcc.v10.i20.6927


