Copyright
©The Author(s) 2022.
World J Clin Cases. May 16, 2022; 10(14): 4460-4469
Published online May 16, 2022. doi: 10.12998/wjcc.v10.i14.4460
Published online May 16, 2022. doi: 10.12998/wjcc.v10.i14.4460
Figure 1 Various pressures measured during transjugular intrahepatic portosystemic shunt in the same patient.
A: Balloon blocking vein and hand pushing of 5 mL contrast medium. Right hepatic vein wedged hepatic vein/venous pressure (WHVP) = 31 mmHg, free hepatic venous pressure (FHVP) = 13 mmHg, and hepatic venous pressure gradient (HVPG) = 18 mmHg; B: Balloon blocking vein and hand pushing of 5 mL of contrast medium. Middle hepatic vein WHVP = 41 mmHg, FHVP = 14 mmHg, and HVPG = 27 mmHg; C: Balloon blocking vein and hand pushing of 5 mL of contrast medium. Left hepatic vein WHVP = 51 mmHg, FHVP = 14 mmHg, and HVPG = 37 mmHg; D: Portal venography and pressure measurement during transjugular intrahepatic portosystemic shunt. Portal vein pressure = 52 mmHg, inferior vena cava pressure = 12 mmHg, and portal pressure gradient = 40 mmHg.
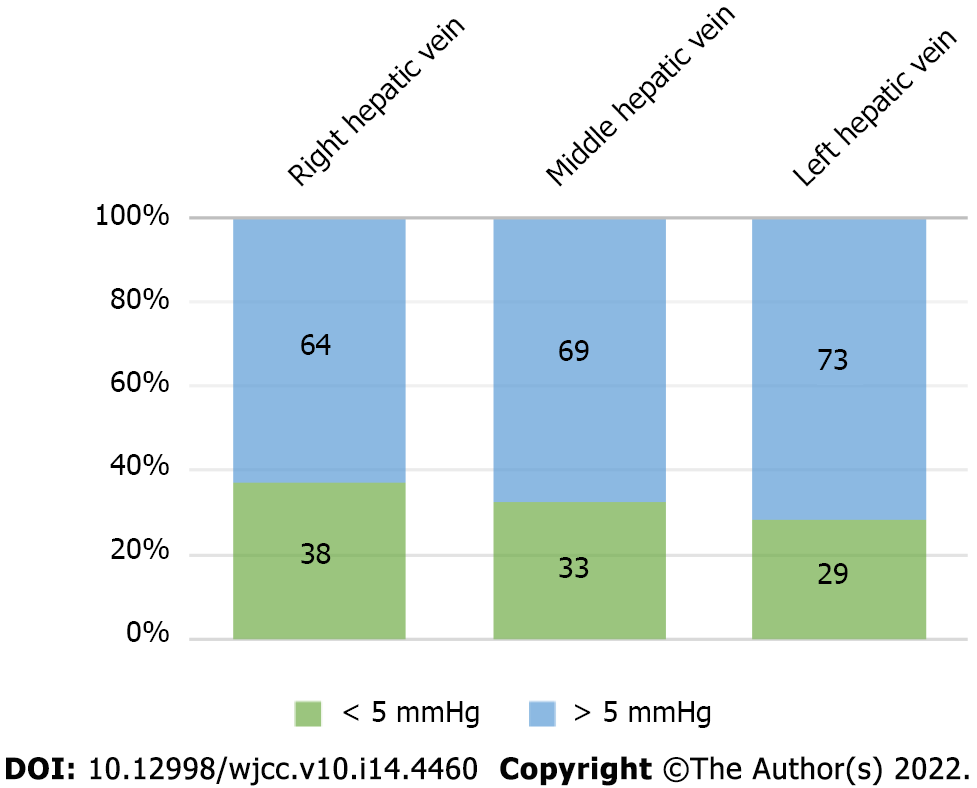
Figure 2 Difference between hepatic venous pressure gradient and portal pressure gradient.
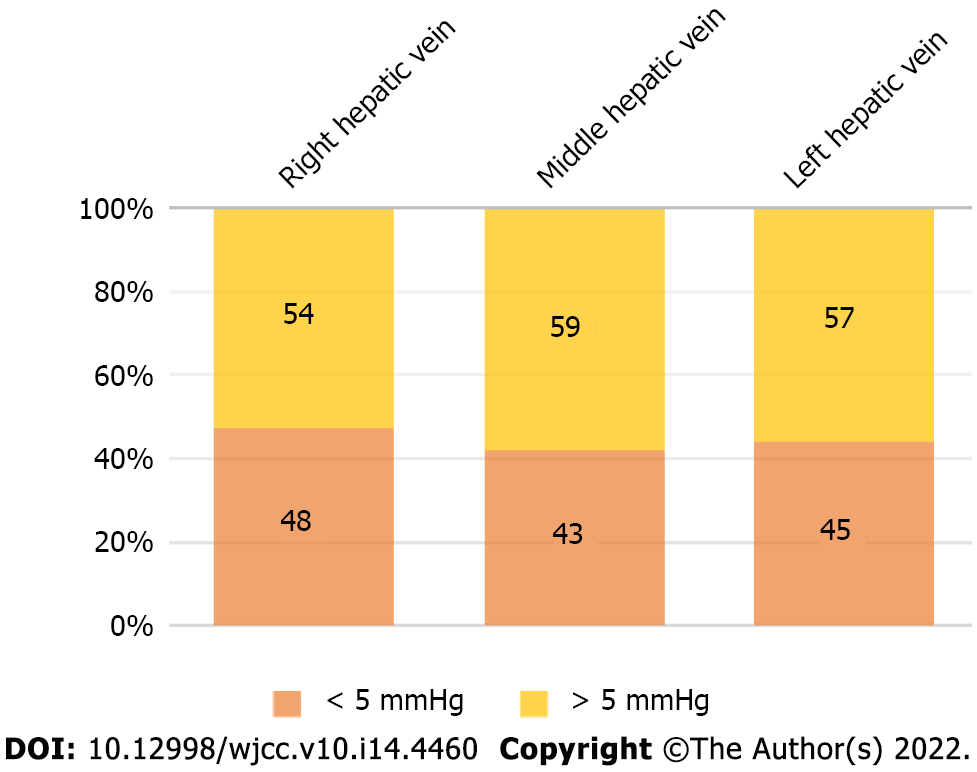
Figure 3 Difference between wedged hepatic vein/venous pressure and portal vein pressure.
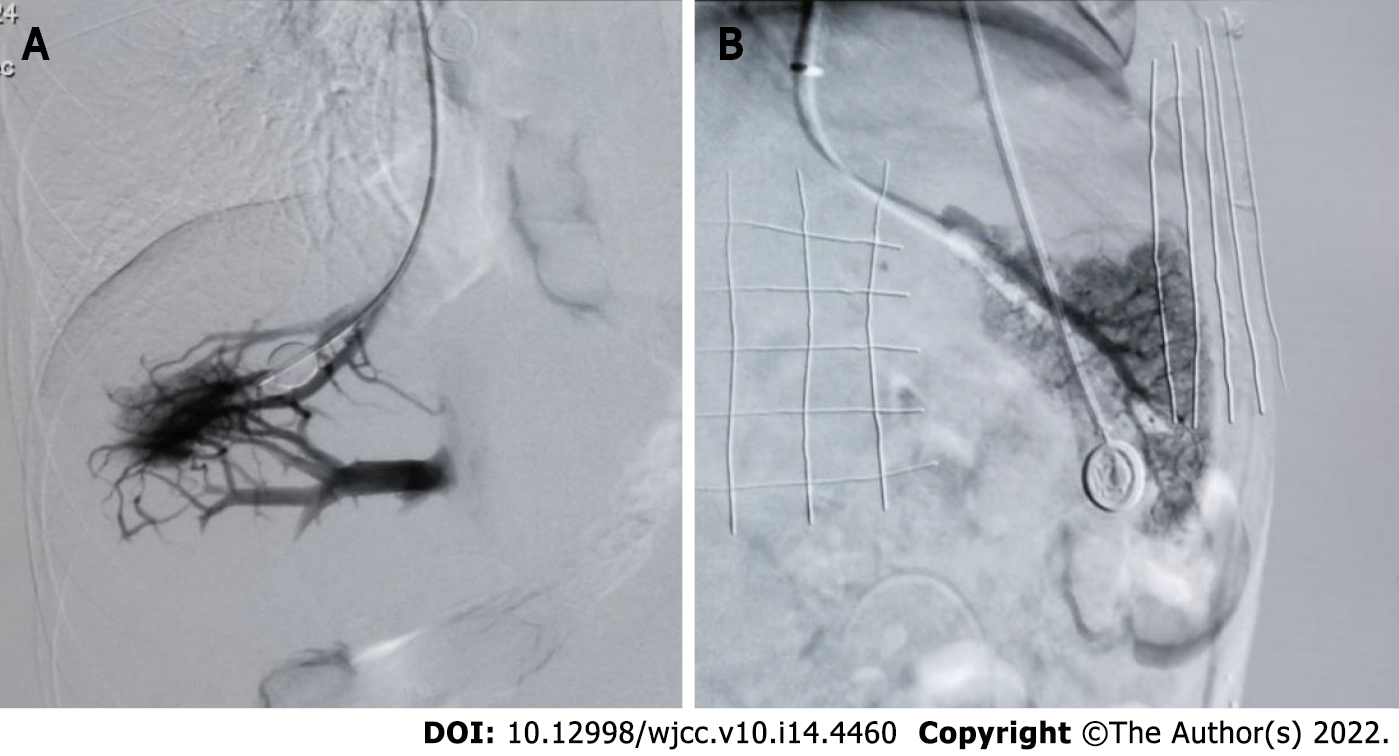
Figure 4 Balloon occlusion.
A: Balloon occlusion of right hepatic vein angiography showed the formation of collateral branches of the hepatic vein; B: Balloon occlusion of left hepatic vein angiography showed that there was no collateral formation of the hepatic vein.
- Citation: Wang HY, Song QK, Yue ZD, Wang L, Fan ZH, Wu YF, Dong CB, Zhang Y, Meng MM, Zhang K, Jiang L, Ding HG, Zhang YN, Yang YP, Liu FQ. Correlation of pressure gradient in three hepatic veins with portal pressure gradient. World J Clin Cases 2022; 10(14): 4460-4469
- URL: https://www.wjgnet.com/2307-8960/full/v10/i14/4460.htm
- DOI: https://dx.doi.org/10.12998/wjcc.v10.i14.4460


