Copyright
©2014 Baishideng Publishing Group Inc.
World J Methodol. Jun 26, 2014; 4(2): 109-122
Published online Jun 26, 2014. doi: 10.5662/wjm.v4.i2.109
Published online Jun 26, 2014. doi: 10.5662/wjm.v4.i2.109
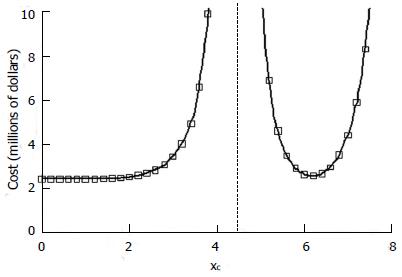
Figure 6 Cost estimates in a scenario with good responsiveness to the control treatment in patients who are non-responsive to the experimental treatment.
π1 = 1.0, π2 = 0, π3 = π4 = 0.4. Other details as in Figure 5. Dashed line divides the x-domain into regions of a significant negative effect (to the left) vs a significant positive effect (right). Near xc = 4.4 the cost of disproving the null hypothesis when it is exactly true becomes infinite.
- Citation: Babbs CF. Choosing inclusion criteria that minimize the time and cost of clinical trials. World J Methodol 2014; 4(2): 109-122
- URL: https://www.wjgnet.com/2222-0682/full/v4/i2/109.htm
- DOI: https://dx.doi.org/10.5662/wjm.v4.i2.109


