Copyright
©The Author(s) 2018.
World J Nephrol. Nov 24, 2018; 7(7): 129-142
Published online Nov 24, 2018. doi: 10.5527/wjn.v7.i7.129
Published online Nov 24, 2018. doi: 10.5527/wjn.v7.i7.129
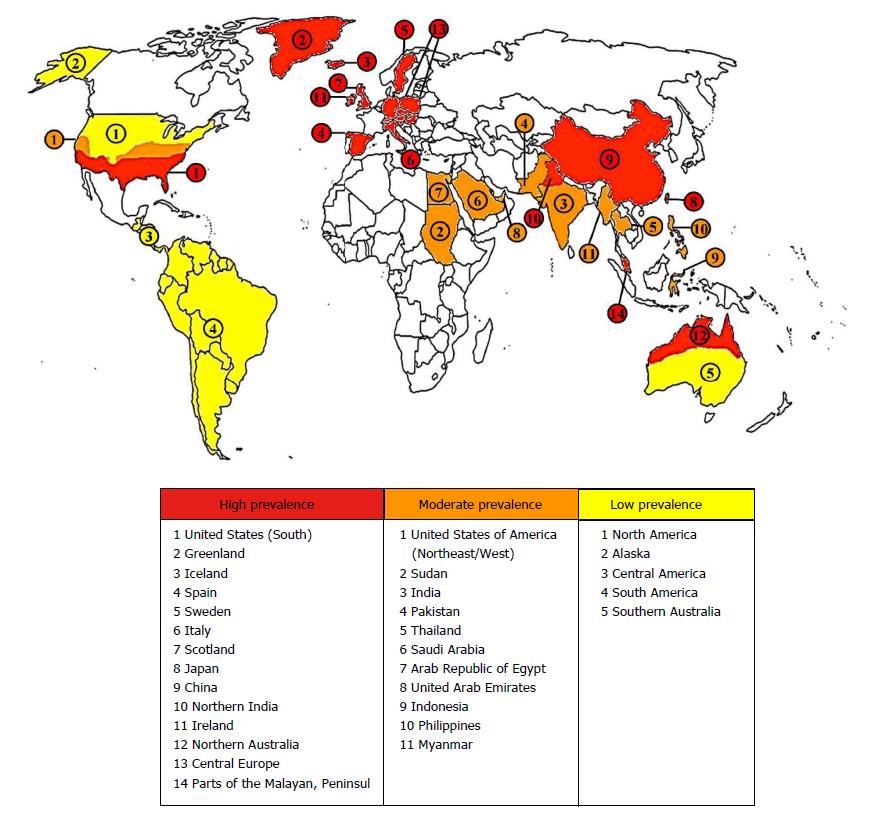
Figure 5 Projected world map of magnitude of nephrolithiasis prevalence.
Magnitude of nephrolithiasis in each country using conglomeration of risk factor indicators dietary intake, obesity, and climate. Degree of prevalence is color coded in red (high prevalence), orange (moderate prevalence), and yellow (low prevalence). High prevalence information obtained through Romero et al[82].
- Citation: Shin S, Srivastava A, Alli NA, Bandyopadhyay BC. Confounding risk factors and preventative measures driving nephrolithiasis global makeup. World J Nephrol 2018; 7(7): 129-142
- URL: https://www.wjgnet.com/2220-6124/full/v7/i7/129.htm
- DOI: https://dx.doi.org/10.5527/wjn.v7.i7.129


