Copyright
©The Author(s) 2016.
World J Nephrol. Sep 6, 2016; 5(5): 429-436
Published online Sep 6, 2016. doi: 10.5527/wjn.v5.i5.429
Published online Sep 6, 2016. doi: 10.5527/wjn.v5.i5.429
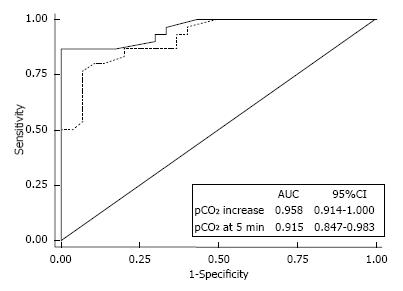
Figure 5 Performance of “RecirCO2lation” test to detect vascular access recirculation.
Receiver operating curves of pCO2-increase (solid line) and pCO2 at 5 min (dotted line) for diagnosis of vascular access recirculation using Glucose Infusion Test (> 0.3%) as reference. Reproduced with permission from Marano et al[32]. AUC: Area under curve; pCO2: Pressure of carbon dioxide.
- Citation: Marano M, D’Amato A, Cantone A. Carbon dioxide: Global warning for nephrologists. World J Nephrol 2016; 5(5): 429-436
- URL: https://www.wjgnet.com/2220-6124/full/v5/i5/429.htm
- DOI: https://dx.doi.org/10.5527/wjn.v5.i5.429


