Copyright
©2014 Baishideng Publishing Group Inc.
World J Nephrol. Nov 6, 2014; 3(4): 256-267
Published online Nov 6, 2014. doi: 10.5527/wjn.v3.i4.256
Published online Nov 6, 2014. doi: 10.5527/wjn.v3.i4.256
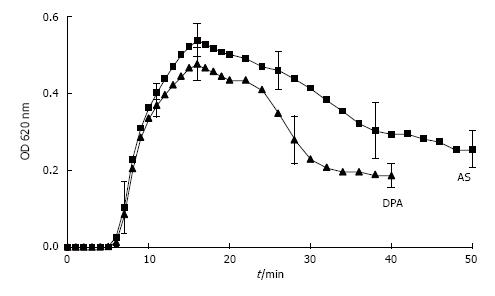
Figure 9 Spectrophotometric crystallization curve of Ox titration in AS and in DPA with pH 6.
0, 100 mmol/L NaCl, initial 2.0 mmol/L Ca2+ and 1.5 m mmol/L Ox addition by titration. (Further details see Figure 8) (mean ± SD, n = 5).
- Citation: Baumann JM, Affolter B. From crystalluria to kidney stones, some physicochemical aspects of calcium nephrolithiasis. World J Nephrol 2014; 3(4): 256-267
- URL: https://www.wjgnet.com/2220-6124/full/v3/i4/256.htm
- DOI: https://dx.doi.org/10.5527/wjn.v3.i4.256


