Copyright
©2012 Baishideng.
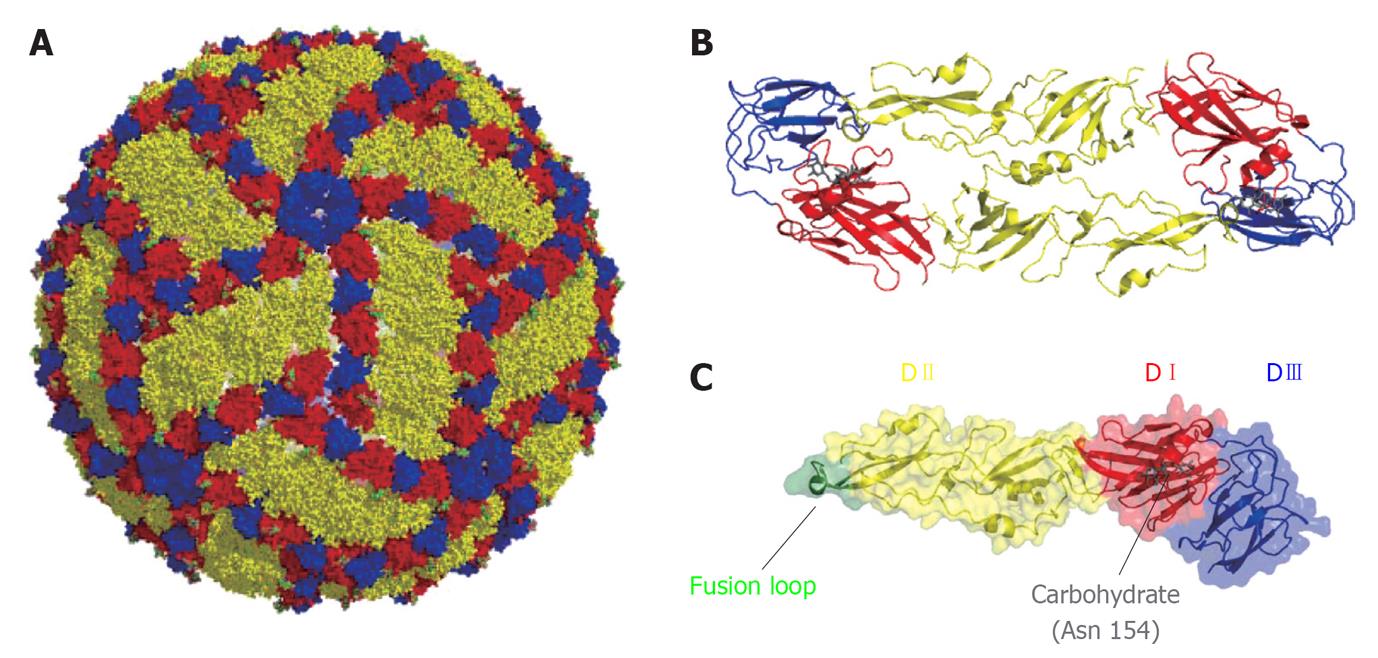
Figure 1 Organization of West Nile virus particle.
A: Representation of West Nile virus particle based on cryoelectron microscopy data[230]. Glycoprotein E is shown on the surface of the particle. Color code: DI (red), DII (yellow) and DIII (blue); B: Ribbon diagram of a dimer of E glycoprotein; C: Structure of a monomer of the soluble ectodomain of E glycoprotein based on the atomic coordinates solved by X-ray crystallography[58]. Fusion loop is highlighted in green. The carbohydrate located at Asn 154 is shown in gray.
- Citation: Martín-Acebes MA, Saiz JC. West Nile virus: A re-emerging pathogen revisited. World J Virol 2012; 1(2): 51-70
- URL: https://www.wjgnet.com/2220-3249/full/v1/i2/51.htm
- DOI: https://dx.doi.org/10.5501/wjv.v1.i2.51


