Copyright
©The Author(s) 2016.
World J Transplant. Mar 24, 2016; 6(1): 174-182
Published online Mar 24, 2016. doi: 10.5500/wjt.v6.i1.174
Published online Mar 24, 2016. doi: 10.5500/wjt.v6.i1.174
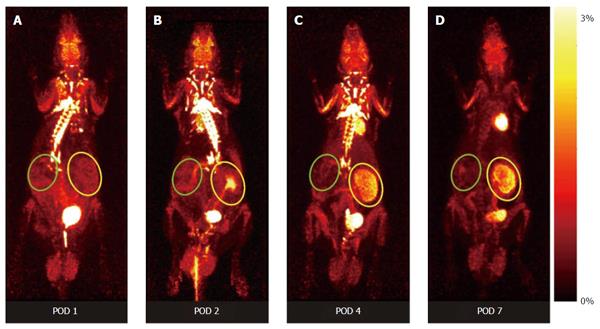
Figure 2 Representative positron emission tomography-images of dynamic whole body acquisitions of a series of an allogeneically transplanted rat [postoperative day 1 (A), 2 (B), 4 (C), and 7 (D)], after tail vein injection of 30 MBq 18F-fluordeoxyglucose (maximum a posterior projection, 180 min pi).
While the allograft undergoing rejection shows distinct enhancement of 18F-FDG (yellow circle) the native control kidney without rejection does not (green circles). Figure taken from[44]. POD: Postoperative day; FDG: Fluordeoxyglucose.
- Citation: Thölking G, Schuette-Nuetgen K, Kentrup D, Pawelski H, Reuter S. Imaging-based diagnosis of acute renal allograft rejection. World J Transplant 2016; 6(1): 174-182
- URL: https://www.wjgnet.com/2220-3230/full/v6/i1/174.htm
- DOI: https://dx.doi.org/10.5500/wjt.v6.i1.174


