Copyright
©The Author(s) 2015.
World J Transplant. Dec 24, 2015; 5(4): 165-182
Published online Dec 24, 2015. doi: 10.5500/wjt.v5.i4.165
Published online Dec 24, 2015. doi: 10.5500/wjt.v5.i4.165
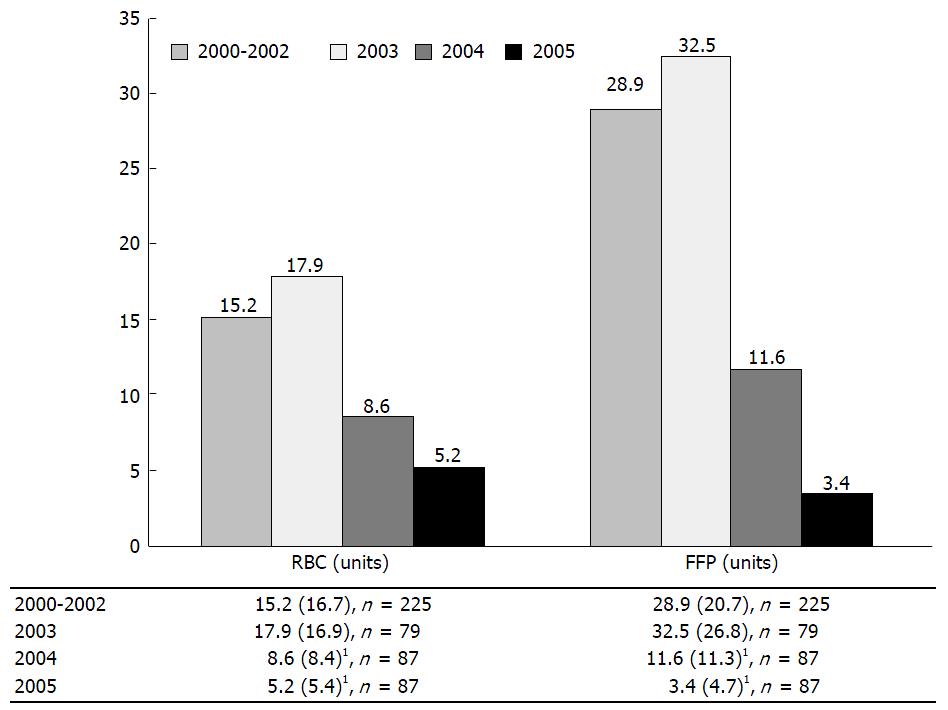
Figure 11 Blood transfusion during liver transplantation per case: Bar plots of red blood cells and fresh frozen plasma by year.
1Indicates a significant difference from the 2000-2002 value at a significance level of P = 0.05 based on the Wald t-test for the respective regression coefficient with adjustments for age, gender, baseline weight and height. FFP: Fresh frozen plasma; n: Samples size; RBC: Red blood cells. From Hevesi et al[125] 2009.
- Citation: Donohue CI, Mallett SV. Reducing transfusion requirements in liver transplantation. World J Transplant 2015; 5(4): 165-182
- URL: https://www.wjgnet.com/2220-3230/full/v5/i4/165.htm
- DOI: https://dx.doi.org/10.5500/wjt.v5.i4.165


