Copyright
©The Author(s) 2025.
World J Psychiatry. Apr 19, 2025; 15(4): 103092
Published online Apr 19, 2025. doi: 10.5498/wjp.v15.i4.103092
Published online Apr 19, 2025. doi: 10.5498/wjp.v15.i4.103092
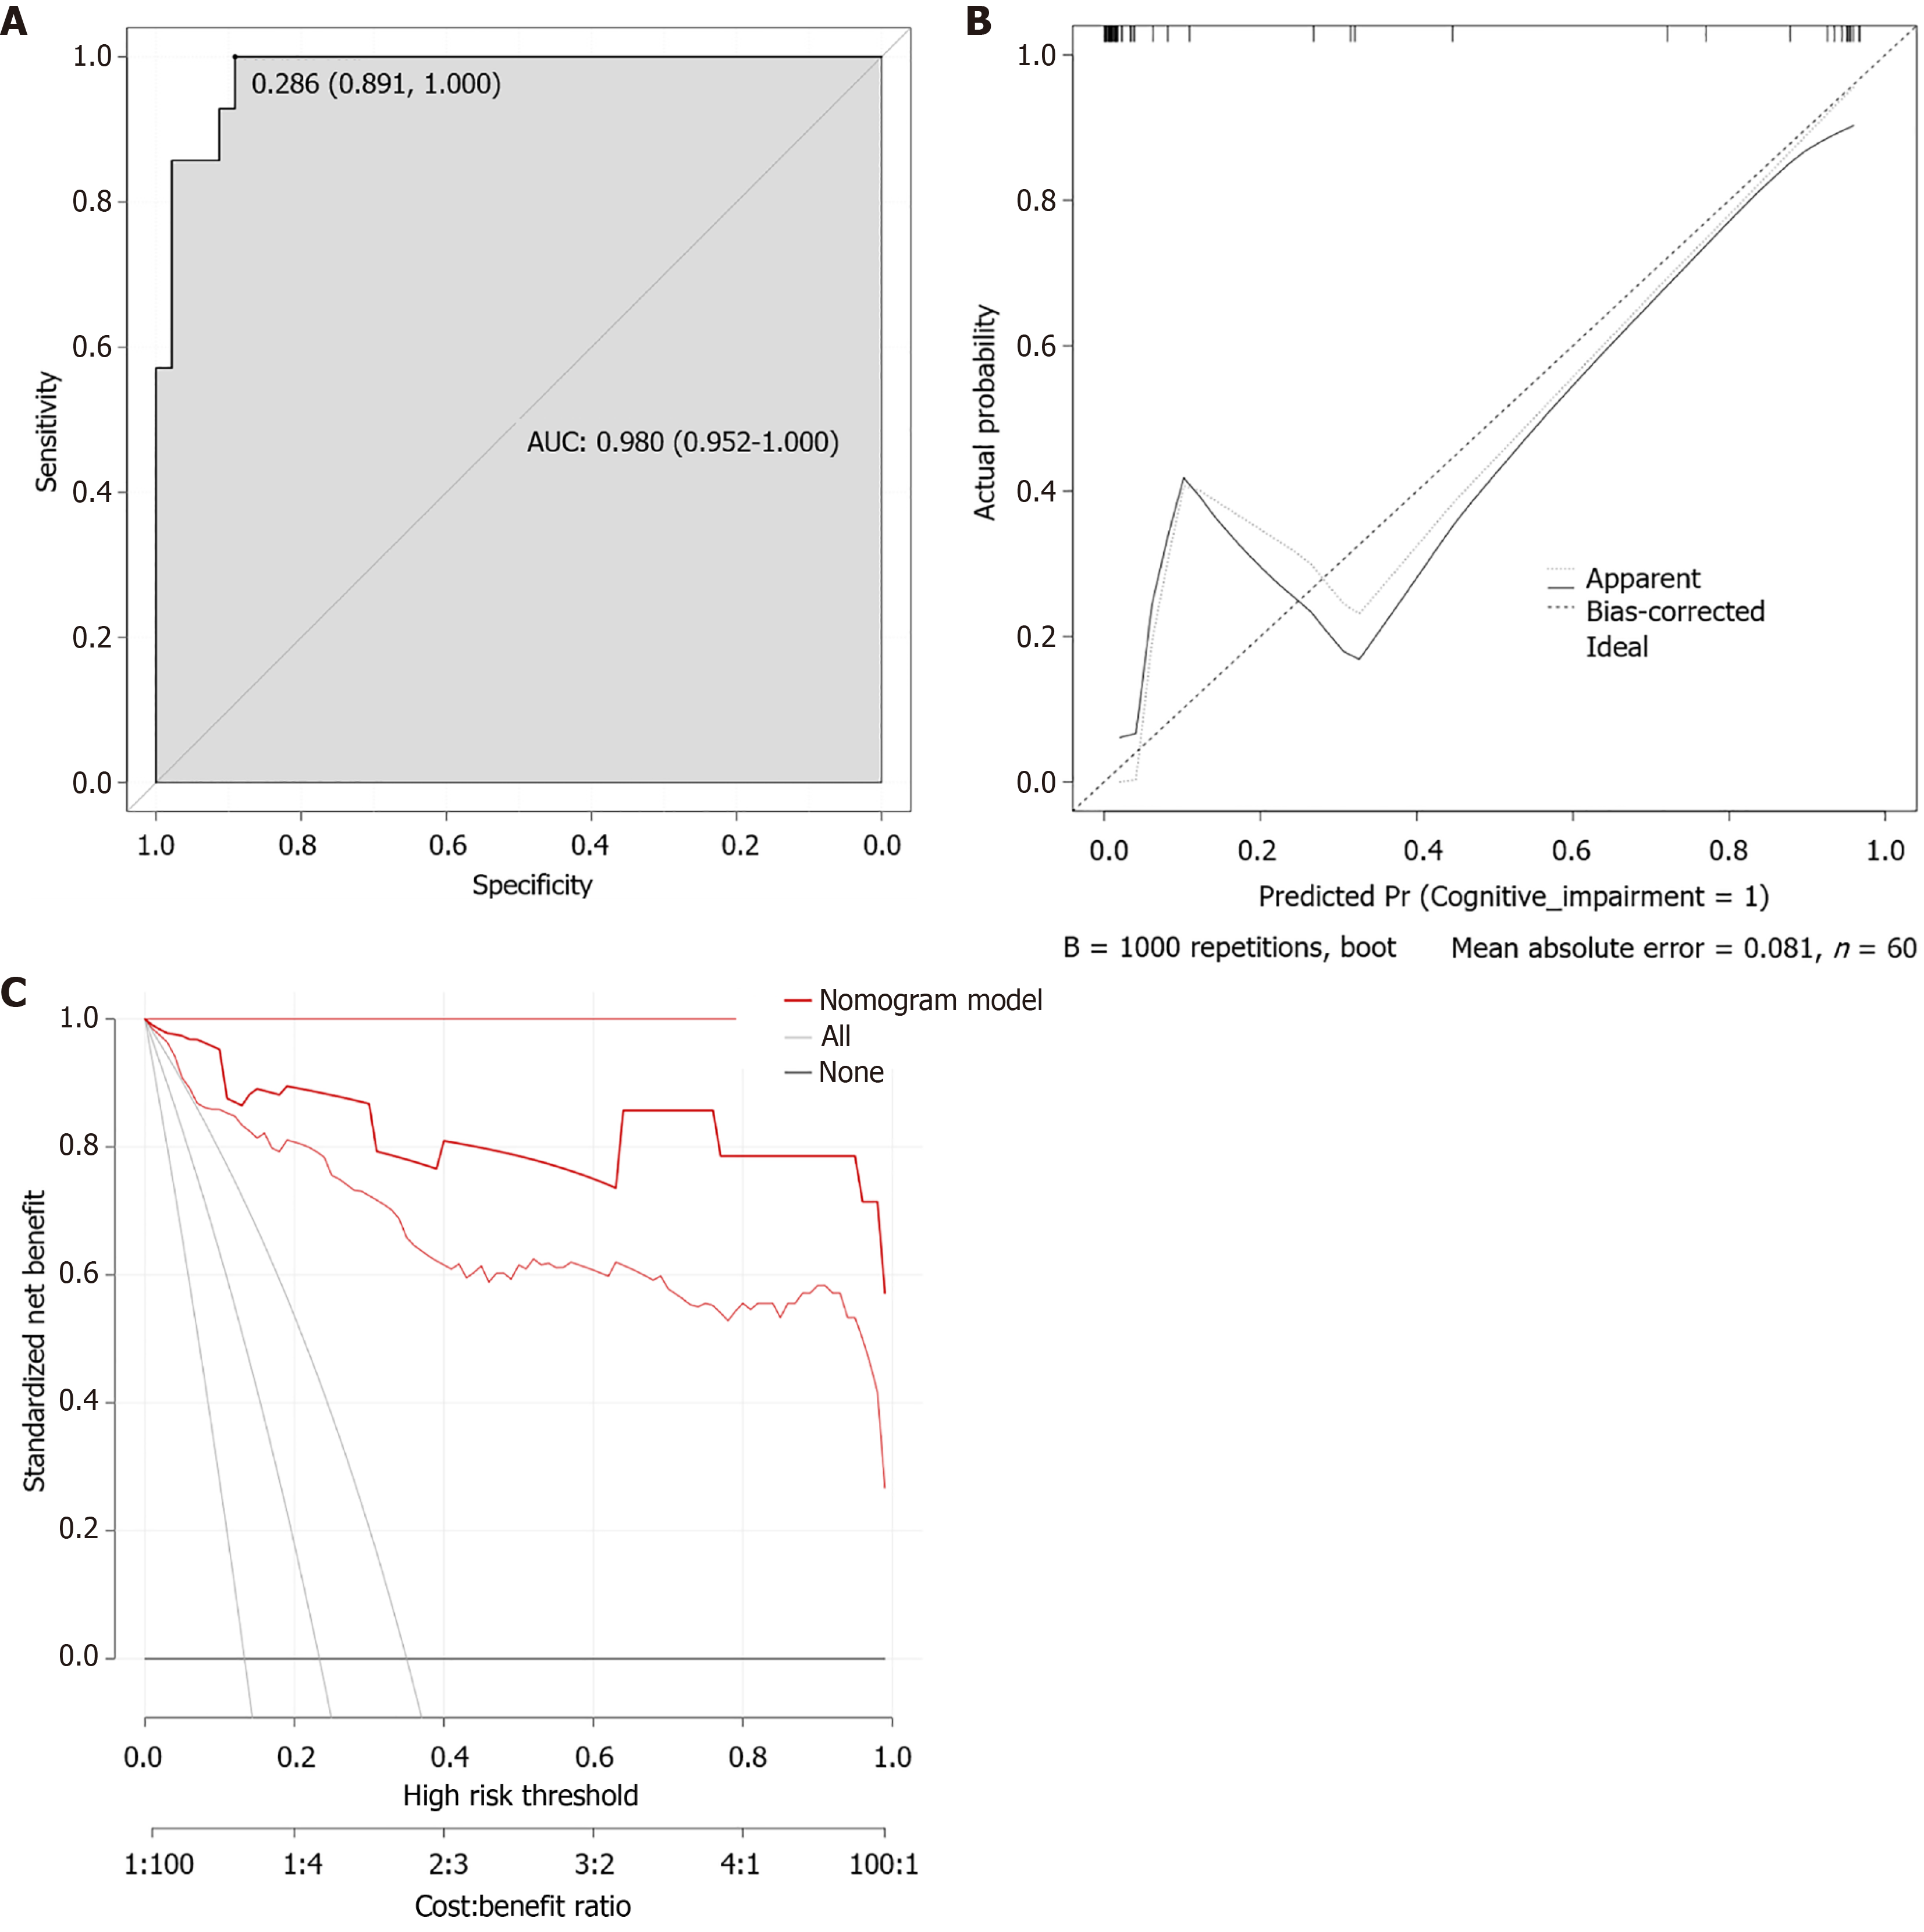
Figure 3 Validation of the column-line diagram model.
A: Verification queue receiver operating characteristic curve. The nomogram of the risk of cognitive impairment constructed by R software for 140 patients in the modeling cohort was externally verified by receiver operating characteristic curve in 60 patients in the validation cohort, with an area under the curve of 0.980; B: Verification queue calibration curve. R software was used to make curve correction for the occurrence model of cognitive impairment in 140 elderly hypertensive patients in the modeling cohort and 60 patients in the verification cohort (mean absolute error = 0.081); C: Verification queue decision analysis curve. R software decision curve analysis was used to evaluate the ability of the model to distinguish the occurrence of cognitive impairment in 140 elderly hypertensive patients in the modeling cohort from 60 patients in the verification cohort. AUC: Area under the curve.
- Citation: Xu Q, Lu SR, Shi ZH, Yang Y, Yu J, Wang Z, Zhang BS, Hong K. Nutritional status of elderly hypertensive patients and its relation to the occurrence of cognitive impairment. World J Psychiatry 2025; 15(4): 103092
- URL: https://www.wjgnet.com/2220-3206/full/v15/i4/103092.htm
- DOI: https://dx.doi.org/10.5498/wjp.v15.i4.103092


